
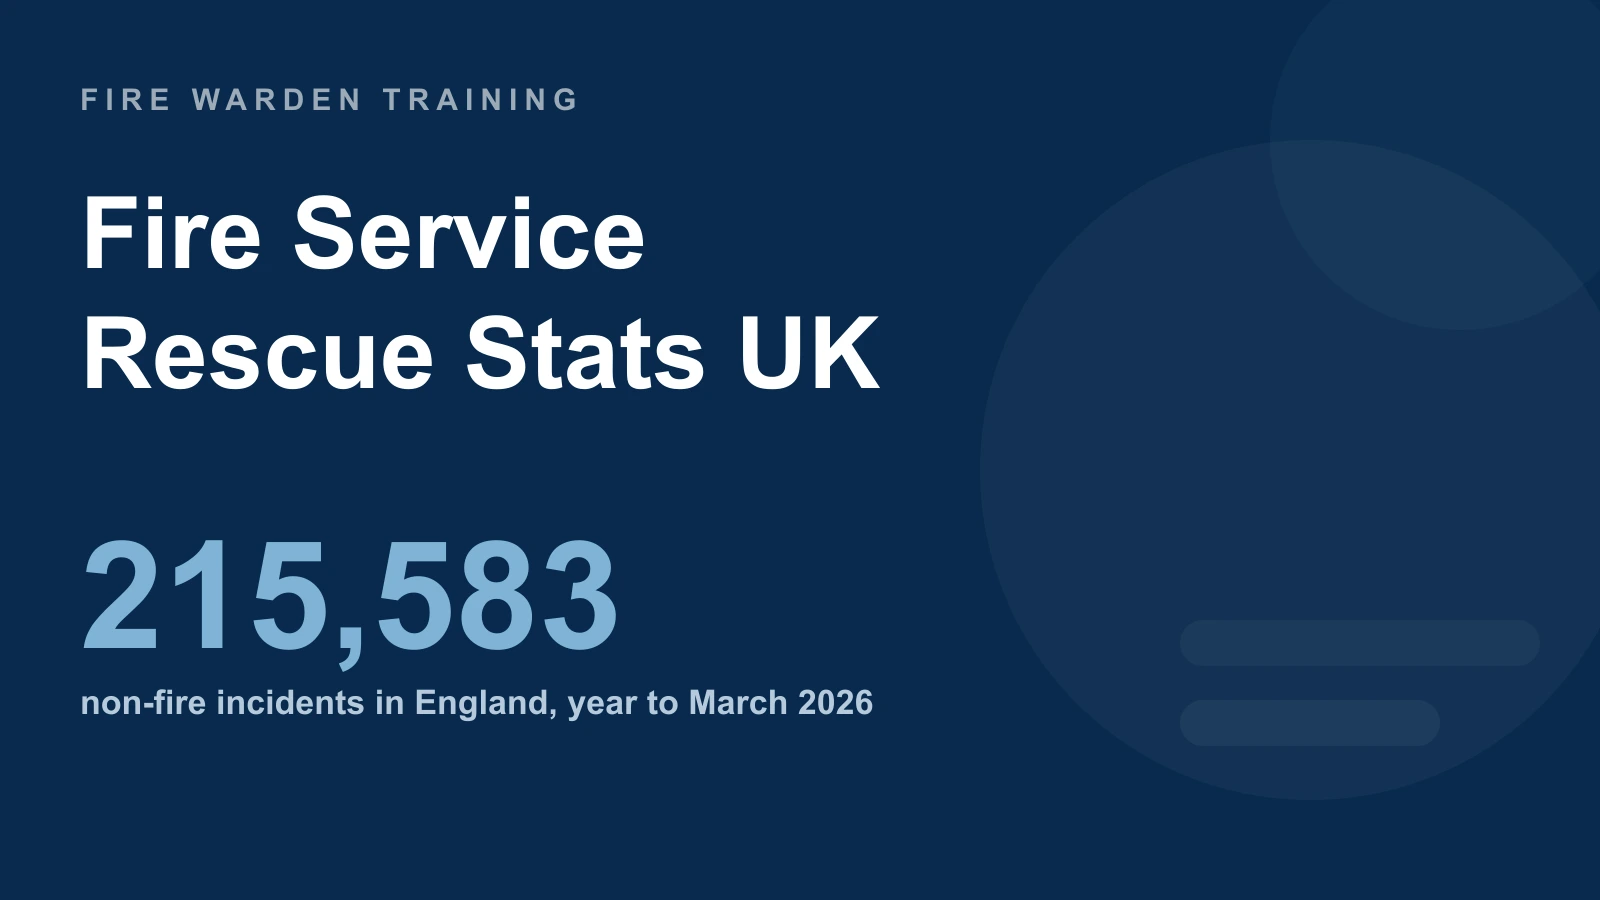
Fire and rescue services in England attended 215,583 non-fire incidents in the year ending March 2026, up 1.7% on the previous year and 41% over ten years. These incidents exceeded the 170,597 fires attended, while fire false alarms were the largest category at 255,047. This page uses official sources to describe the service’s non-fire workload, with periods and definitions stated alongside the figures.
It’s written for anyone who needs citable, up-to-date numbers on what firefighters actually spend their time doing — journalists chasing an animal-rescue or flooding story, pet-care and insurance content teams, flood-resilience and building-management bodies, and fire-service funding commentators after a single-source workload figure. Every number is dated and sourced. Where a related topic has its own dedicated page in our statistics cluster we carry a single headline here and link out rather than duplicate it.
Key facts and figures
- 215,583 non-fire incidents attended in England in 2025/26, compared with 211,900 in 2024/25.
- 41% increase over ten years, from 153,006 in 2015/16; 43% above 151,031 in 2020/21.
- 32,713 road traffic collisions attended in England in 2025/26, up 1.5% from 32,216.
- 41,130 effecting-entry-or-exit incidents in 2025/26, up 3.1% annually and 134% over ten years.
- 13,760 lift-release incidents in England in 2025/26 — about 265 a week.
- 17,502 flooding and water-rescue incidents: 15,920 flooding and 1,582 rescue or evacuation from water.
- 6,394 animal-assistance incidents in England in 2025/26, up 8.6% from 5,888.
- 30,660 incidents assisting other agencies in 2025/26, up 0.8% from 30,430.
Checked on 15 October 2026 using MHCLG’s September 2026 detailed release and the Welsh Government’s 6 October 2026 bulletin. England figures below use the year ending March 2026 unless stated otherwise. Counts describe incidents attended, not the total number of people or animals rescued.
What do firefighters do apart from fighting fires?
England’s fire and rescue services attended 215,583 non-fire incidents in 2025/26, about 34% of their 641,227 incidents. The work includes road collisions, flooding, medical response, entry to premises, lift releases, animal assistance, hazardous-material incidents and support for other agencies. False fire alarms accounted for a larger share of all attendance than non-fire incidents.
London Fire Brigade separately reported 2,455 people rescued across 44 emergency types in 2025/26, an average of nearly seven a day. Its definition includes people who died before, during or after attendance, so this must not be labelled 2,455 lives saved. The total included 247 people rescued at fires, 1,050 behind locked doors and 379 from lifts.
The sections below describe incident categories from the national statistics. Rescues at fires are covered separately on our fire evacuation statistics page.
How many non-fire incidents do UK fire services attend each year?
England recorded 215,583 non-fire attendances in 2025/26, up 1.7% from 211,900 a year earlier, 43% from 151,031 five years earlier and 41% from 153,006 ten years earlier. Comparisons must use matching financial-year periods rather than mixing March and September rolling totals.
Wales provisionally recorded 10,983 Special Service Incidents, including non-fire false alarms, in 2025/26: around 30% of 37,012 incidents attended. Scotland’s latest annual incident release remains 2024/25 as at this review; its next release is scheduled for 30 October 2026. Keep the nations’ definitions and reporting years separate.
How many road traffic collisions and extrications do fire services attend?
Fire and rescue services attended 32,713 road traffic collisions in England in 2025/26, up 1.5% from the revised 32,216 in 2024/25. Attendance does not necessarily involve freeing someone trapped in a vehicle: crews may provide other assistance or make the scene safe.
This is a fire-service attendance measure, not the total number of road collisions, road casualties or people extricated. Road-casualty statistics use a separate reporting system. A collision count cannot be converted into a rescue count without the relevant incident detail.
How often do firefighters force entry or release people from lifts?
Effecting entry or exit accounted for 41,130 incidents in England in 2025/26, up 3.1% from 39,894 and 134% from 17,572 ten years earlier. The latest total included 11,274 incidents classed as medical cases. The category describes the work done; it does not by itself establish why demand has changed.
There were 13,760 lift-release incidents in 2025/26, averaging about 265 each week. This is an incident count: an attendance can involve more than one person. The table compares six major non-fire categories on the same reporting period.
| Non-fire category (England) | Incidents 2025/26 | Note |
|---|---|---|
| Effecting entry or exit | 41,130 | Up 3.1% annually; 134% over ten years |
| Road traffic collisions | 32,713 | Up 1.5%; not an extrication count |
| Assisting other agencies | 30,660 | Up 0.8% annually |
| Flooding and water rescue | 17,502 | 15,920 flooding + 1,582 rescue/evacuation |
| Medical incidents | 10,602 | Down 22% annually |
| Lift release | 13,760 | About 265 incidents a week |
Medical incidents, including co-responding and first responding, accounted for 10,602 attendances, down 22% from 13,632 a year earlier. They are a distinct incident category and should not be added to medical subcategories within entry-or-exit incidents as though all measures were separate people.
How much flooding and water-rescue work do fire services do?
Flooding and water-rescue attendances totalled 17,502 in England in 2025/26: 15,920 flooding incidents and 1,582 rescues or evacuations from water. The combined total fell 5.8% from 18,570 a year earlier but was 17% above the 15,007 recorded ten years earlier.
MHCLG notes that annual fluctuations generally align with rainfall changes. These incidents include pumping out and water-related rescues or evacuations; they are not counts of drowning deaths or people rescued. The statistics do not quantify how much of an individual year’s change was caused by climate change.
Do fire services rescue animals, and how much does it cost?
England’s services attended 6,394 animal-assistance incidents in 2025/26, up 8.6% from 5,888. Of the latest incidents, 3,640 involved a domestic animal, 1,566 a wild animal, 992 livestock and 196 birds. The recorded category describes the primary animal type when more than one is involved; it is not an animal headcount.
The largest recorded situations were trapped animals (2,799 incidents) and rescues from height (1,652). These national data do not provide a comparable total rescue cost. Local datasets may publish notional resource costs, which should not be interpreted as a charge to callers or extrapolated into a UK total.
How often do fire services assist other agencies?
England recorded 30,660 incidents assisting other agencies in 2025/26, compared with 30,430 in 2024/25. This is a defined recording category. Related work recorded under entry or exit, medical incidents or other categories is not automatically included in this count.
Entry-or-exit, assisting-other-agencies and medical incidents totalled 82,392 attendances across their separate headline categories. This shows the scale of that work, but does not measure people helped, time spent or the resources available to respond to other incidents.
Frequently asked questions
What do firefighters do apart from fighting fires?
They attend road collisions, flooding, water rescue, entry-or-exit incidents, lift releases, medical incidents, animal assistance and other emergencies. England recorded 215,583 non-fire incidents in 2025/26, compared with 170,597 fires.
How many non-fire incidents do UK fire services attend each year?
England recorded 215,583 non-fire incidents in 2025/26. Wales provisionally recorded 10,983 Special Service Incidents including non-fire false alarms. The definitions and periods in separate national releases should be retained rather than presenting these as a complete UK total.
Do fire services rescue animals, and how much does it cost?
Yes. England recorded 6,394 animal-assistance incidents in 2025/26. The national release does not provide a comparable total cost. Incident counts and local notional costs should not be presented as numbers of animals saved or bills charged to callers.
How often do firefighters release people trapped in lifts?
England recorded 13,760 lift-release incidents in 2025/26, averaging about 265 a week. More than one person can be involved in a single attendance.
Where do these fire service rescue statistics come from?
The main source is MHCLG’s detailed non-fire analysis and FIRE0901 series for England. Welsh and Scottish official releases cover their own jurisdictions; London Fire Brigade provides separate local rescue figures.
If you’re responsible for fire safety at work, the takeaway is the same as ever: a fire and rescue service stretched across record non-fire demand is a reason to lean more on your own preparedness, not less. Our Fire Warden Training course covers evacuation, sweeps, assembly-point management and everyday fire safety checks — £18 per learner, RoSPA approved and CPD accredited, 60 to 90 minutes online, with an instant certificate on passing and bulk discounts from 10 delegates.
Related guides
- Fire and Rescue Service Statistics UK: Incidents, Stations, Staffing & Funding
- Fire Evacuation Statistics UK: Rescues, Drills & Behaviour Data
- High-Rise Fire Statistics UK: Buildings, Risk & Response
- Fire Door Statistics UK: Failures, Inspections & Compliance
- Fire marshal responsibilities: the complete UK duties list
Sources & references
- MHCLG — Detailed non-fire incident analysis, England 2025/26
- MHCLG — Fire and rescue incident statistics, England 2025/26
- Welsh Government — Fire and rescue incidents 2025/26, provisional
- Scottish Fire and Rescue Service — Official statistics and publication schedule
- London Fire Brigade — 2,455 people rescued in 2025/26, definitions and breakdown
A fire service stretched across record non-fire demand makes your own preparedness matter more — get your team certified with accredited, workplace-ready training.
Explore the Fire Warden Training course →
Mark writes about workplace health & safety, fire safety and accredited online training for Fire Warden Training, part of Online CPD Academy.