
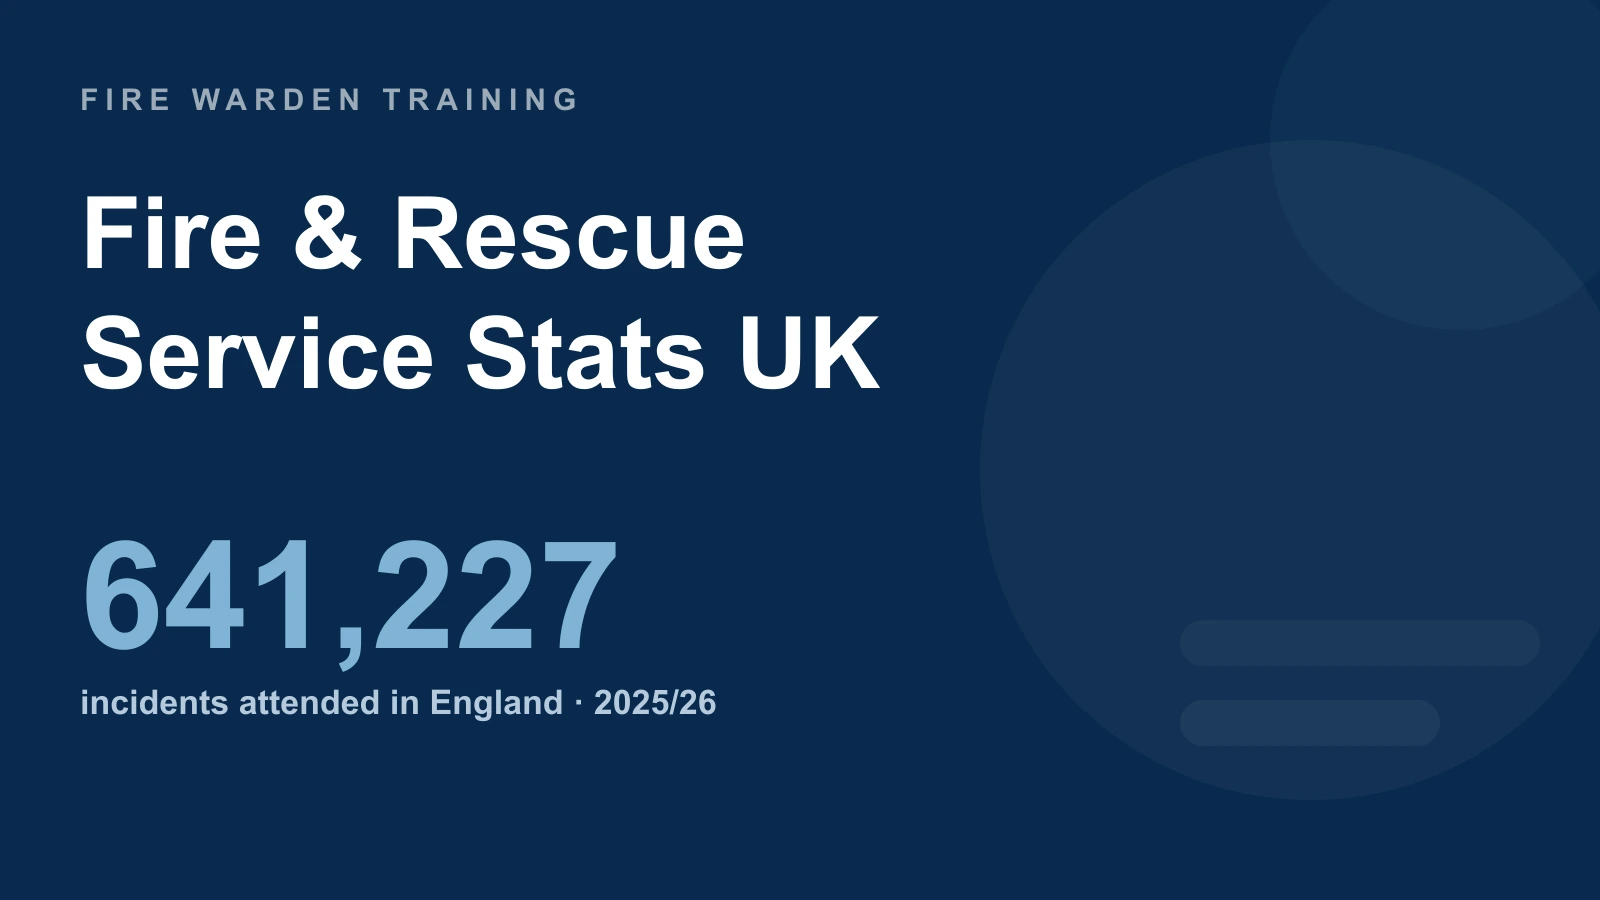
Fire and rescue services in England attended 641,227 incidents in 2025/26, up 5.8% on the previous financial year. This page brings together incident totals, station and workforce figures, and funding. It uses official England, Scottish and Welsh releases and identifies each figure’s period and scope.
It’s written for anyone who needs citable, up-to-date numbers on the state of the fire service — journalists, councillors and fire-governance scrutiny leads, consultants, insurers, and bid writers. Every figure is dated and sourced, and where a topic has its own dedicated page in our statistics cluster we carry a single headline here and link out rather than duplicate it.
Key facts and figures
- 641,227 incidents were attended by fire and rescue services in England in 2025/26, up 5.8% on 2024/25.
- 49 territorial fire and rescue services are represented by the national totals: 44 in England, three in Wales, and one each in Scotland and Northern Ireland.
- 1,386 fire stations were recorded in England at 31 December 2025, compared with 1,439 at 31 March 2010; the collection basis changed in 2024.
- 30,601 full-time-equivalent firefighters were employed in England at 31 March 2025 — down 14% over the decade.
- £1.99bn of core spending power is made available to standalone fire and rescue authorities in England for 2026-27, a 4.4% cash rise.
- 170,597 fires and 215,583 non-fire incidents were attended in England in 2025/26; non-fire incidents reached their highest financial-year total in the consistent series.
- 17% was the NAO’s estimated average real-terms fall in standalone fire authorities’ spending power between 2010/11 and 2015/16, a historical comparison.
- 37,012 incidents were recorded in Wales in provisional 2025/26 data; Scotland’s latest published incident release covers 2024/25 and reports more than 74,000.
Checked on 15 October 2026. England and Wales incident figures cover 2025/26; Scotland’s latest incident release covers 2024/25. England’s workforce figures remain March 2025, stations are December 2025, and funding is the 2026/27 settlement. These periods are labelled separately throughout.
How many fire and rescue services are there in the UK?
The national territorial-service counts are 44 in England, three in Wales, and one each in Scotland and Northern Ireland: 49 in total. This is a count of territorial services, not every organisation operating firefighters, such as airport or industrial fire teams.
English services have different governance arrangements, including county councils, combined fire authorities, mayoral arrangements and police, fire and crime commissioners. The standalone-authority funding total below is only one part of the national funding picture.
Scotland and Wales run differently again: Scotland has operated a single national service since 2013, while Wales retains three regional services (North Wales, Mid and West Wales, and South Wales). Northern Ireland has one service covering the whole region.
How many incidents do UK fire services attend each year?
England’s 641,227 incidents in 2025/26 were 5.8% above 2024/25, 24% above five years earlier and 21% above ten years earlier. The mix of fires, false alarms and non-fire work has also changed over time.
The composition of that total tells the story of the modern service:
- 170,597 fires, up 19% on 2024/25. The official release reports a large increase in secondary fires during 2025/26.
- 215,583 non-fire incidents, up 1.7% on 2024/25 and the largest financial-year total since consistent data became available.
- 255,047 fire false alarms, up 1.6% on 2024/25 and the largest of the three incident groups.
Non-fire incidents were 41% above their 2015/16 level. In 2025/26 they included 32,713 road traffic collisions and 17,502 flooding or water rescue/evacuation incidents. These categories describe different demands on the service; this page uses the official station count to describe the estate.
England recorded 254 fire-related fatalities in 239 fatal fires in 2025/26, compared with 280 fatalities in 255 fatal fires in 2024/25. Figures can be revised as incident records and investigations are updated.
How many fire stations are there in the UK?
FIRE1404 records 1,386 English fire stations at 31 December 2025, compared with 1,439 at 31 March 2010. The collection changed from CIPFA returns to direct incident-system data in 2024, and the reference date changed from March to December. The current total is split into three crewing categories:
| Station type (England) | Number at 31 December 2025 | What it means |
|---|---|---|
| Wholetime | 408 | Staffed by wholetime firefighters |
| On-call (retained) | 737 | Crewed by on-call firefighters who respond from home or work |
| Mixed | 241 | Wholetime and on-call staffing arrangements |
| Total | 1,386 | 2010 total: 1,439; collection basis changed in 2024 |
The 737 on-call stations were more than half of the recorded English total. A further 241 were classified as mixed. Station numbers alone do not measure available crew hours or response capability, and volunteer stations are excluded from this table.
How many firefighters are there in the UK?
England employed 30,601 FTE firefighters at March 2025, down 0.5% on the previous year, 4.1% over five years and 14% over ten years. This firefighter total excludes the separately reported 1,149 FTE control staff and 8,333 FTE support staff.
At March 2025, women were 9.7% of England’s firefighter headcount (3,310). Among firefighters who stated their ethnicity, 5.6% (1,793) were from an ethnic minority background. These diversity figures use headcounts and should not be calculated from the FTE staffing total.
The headline workforce figure is the FTE count for England only; because the four UK nations publish workforce data on different bases and dates, there is no single clean UK-wide firefighter total, which is why the reliable national anchor is the England FTE figure plus the separate national releases.
How much funding do fire and rescue services get?
The final 2026/27 settlement makes almost £1.99 billion of core spending power available to standalone fire and rescue authorities in England, a 4.4% cash increase on 2025/26. The government committed to a minimum 3.8% increase for each standalone authority. Core spending power combines specified grants, retained business rates and assumed council-tax resources.
For historical context, the NAO estimated that standalone authorities’ government funding fell by an average 28% in real terms between 2010/11 and 2015/16. After council tax and other income, the estimated average spending-power reduction was 17%. Those findings describe that earlier period; they are not a measurement of the change through 2026.
The £1.99 billion covers standalone authorities, not all UK fire-service spending. A cash percentage also differs from an inflation-adjusted change, while national totals do not show the circumstances of each authority.
What about Scotland, Wales and Northern Ireland?
Scotland’s latest published incident release, for 2024/25, reports more than 74,000 emergencies, almost 6,000 fewer than the preceding year. It includes 4,104 accidental house fires, down 3.6% on the year and 26.4% since 2014/15. Scotland’s 2025/26 incident release is scheduled for 30 October 2026, after this review date.
Wales’s provisional 2025/26 release records 37,012 incidents: 11,373 fires, 14,656 fire false alarms and 10,983 special-service incidents. The release was published on 6 October 2026. Its data are provisional and should be read separately from the earlier Scottish period.
| Nation | Incidents attended | Data period | Note |
|---|---|---|---|
| England | 641,227 | 2025/26 | Up 5.8% on the year; 21% over ten years |
| Scotland | >74,000 | 2024-25 | ~6,000 fewer than the previous year |
| Wales | 37,012 | 2025/26 provisional | 11,373 fires; 14,656 fire false alarms; 10,983 special-service incidents |
Northern Ireland’s single service publishes separately again. Because the four nations use different definitions, boundaries and reporting years, these totals should be read side by side rather than simply summed into one UK figure.
How does workload translate into response on the ground?
The average total response time to primary fires in England was 9 minutes 25 seconds in 2025/26, 19 seconds longer than in 2024/25. This national average is not a guaranteed attendance time. It does not by itself establish how much of the change was caused by staffing, demand, geography or other factors.
For employers, the practical takeaway is simple. A service attending record non-fire workload with 14% fewer firefighters than a decade ago is not a reason to lean less on your own arrangements — it is a reason to lean more. The faster and more competent the in-house response, the less depends on the exact minute the first appliance arrives, which is where a trained fire warden team earns its place.
Frequently asked questions
How many fire and rescue services are there in the UK?
The national territorial-service counts total 49: 44 in England, three in Wales, and one each in Scotland and Northern Ireland. Airport, industrial and other specialist fire teams are outside that count.
How many incidents do UK fire services attend each year?
England attended 641,227 incidents in 2025/26. Wales recorded 37,012 in provisional 2025/26 data. Scotland’s latest published incident release covers 2024/25 and reports more than 74,000. These differently dated figures should be presented separately.
How many firefighters are there in the UK?
England employed 30,601 full-time-equivalent firefighters at 31 March 2025, down 14% over the decade. There is no single clean UK-wide total because the four nations publish workforce data on different bases; Scotland, Wales and Northern Ireland report separately.
How much funding do fire and rescue services get?
Almost £1.99 billion of core spending power is available to standalone English fire and rescue authorities in 2026/27, a 4.4% cash increase. It is not total UK fire-service expenditure. Historical NAO reductions quoted on this page refer to 2010/11–2015/16.
How many fire stations are there in England?
FIRE1404 records 1,386 at 31 December 2025: 408 wholetime, 737 on-call and 241 mixed. The 2010 total was 1,439, but the data source and reference date changed in 2024. Volunteer stations are excluded.
Where do UK fire and rescue service statistics come from?
The core data is MHCLG’s fire and rescue incident statistics and fire statistics data tables for England, the England fire workforce and pensions statistics, and the House of Commons Library on funding, plus the Scottish Fire and Rescue Service and Welsh Government annual releases. England’s incident statistics are quarterly; workforce, stations and funding refresh annually.
If you’re responsible for fire safety at work, these numbers set the context: a busier, leaner fire service means your own preparedness matters more, not less. Our Fire Warden Training course covers evacuation, sweeps, assembly-point management and everyday fire safety checks — £18 per learner, RoSPA approved and CPD accredited, 60 to 90 minutes online, with an instant certificate on passing and bulk discounts from 10 delegates.
Related guides
- Fire Service Response Time Statistics UK: How Fast Crews Arrive
- Firefighter Statistics UK: Numbers, Workforce & Diversity Data
- Fire Safety Enforcement Statistics UK: Audits & Notices
- Fire Evacuation Statistics UK: Rescues, Drills & Behaviour Data
- Fire marshal: a complete UK guide to the role, duties and training
Sources & references
- MHCLG — England fire and rescue incidents, year ending March 2026
- MHCLG — Detailed fire analysis and response times, year ending March 2026
- MHCLG — England fire workforce and pensions, March 2025
- MHCLG — FIRE1404 station counts, definitions and collection changes
- House of Commons Library — Government support for fire and rescue services, March 2026
- National Audit Office — Financial sustainability of fire and rescue services, 2015
- SFRS — Incident statistics 2024/25
- SFRS — Statistical releases and publication schedule
- Welsh Government — Provisional fire and rescue incident statistics, 2025/26
A busier, leaner fire service makes your own preparedness matter more — get your team certified with accredited, workplace-ready training.
Explore the Fire Warden Training course →
Mark writes about workplace health & safety, fire safety and accredited online training for Fire Warden Training, part of Online CPD Academy.