
England’s house-fire hotspots
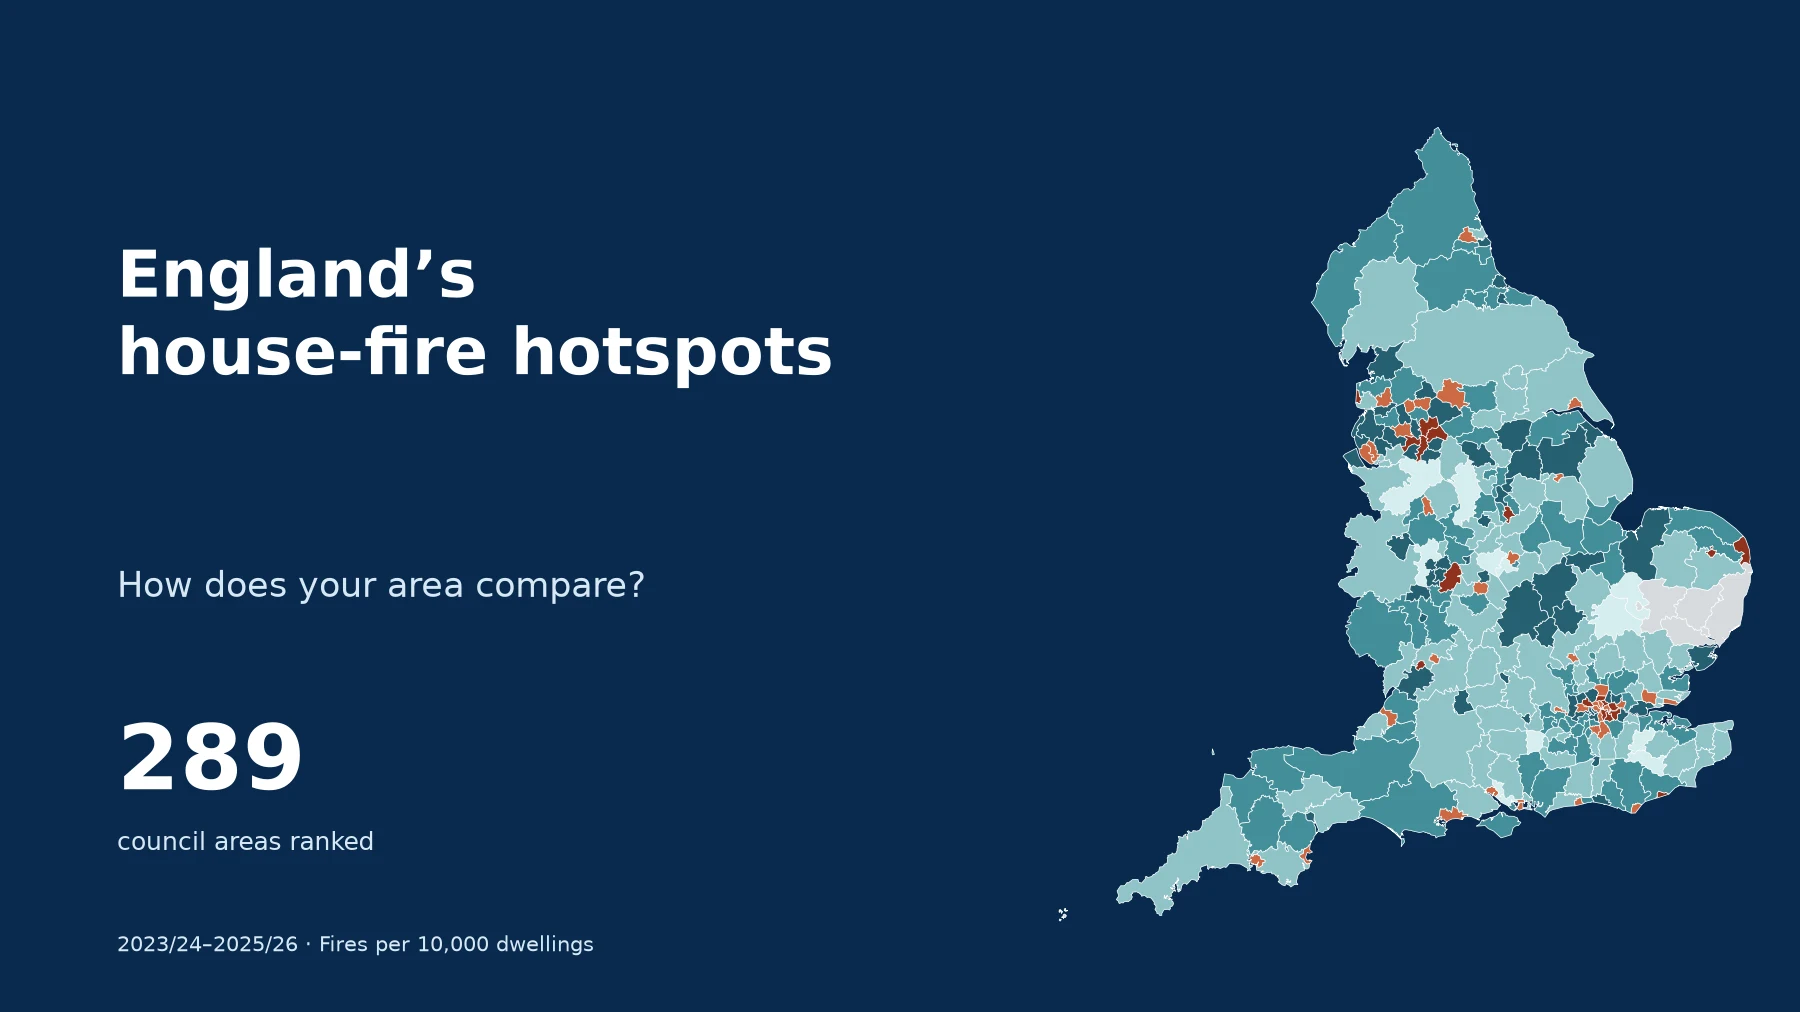
House fire statistics for 289 council areas in England, covering April 2023–March 2026. Compare the highest and lowest recorded rates, adjusted for the number of homes in each area.
- Council areas ranked
- 289
- Complete financial years
- 3
- Fires in ranked areas
- 76,305
- Annual rate across ranked areas
- 10.1per 10,000 dwellings
Manchester records the highest rate; Hart the lowest
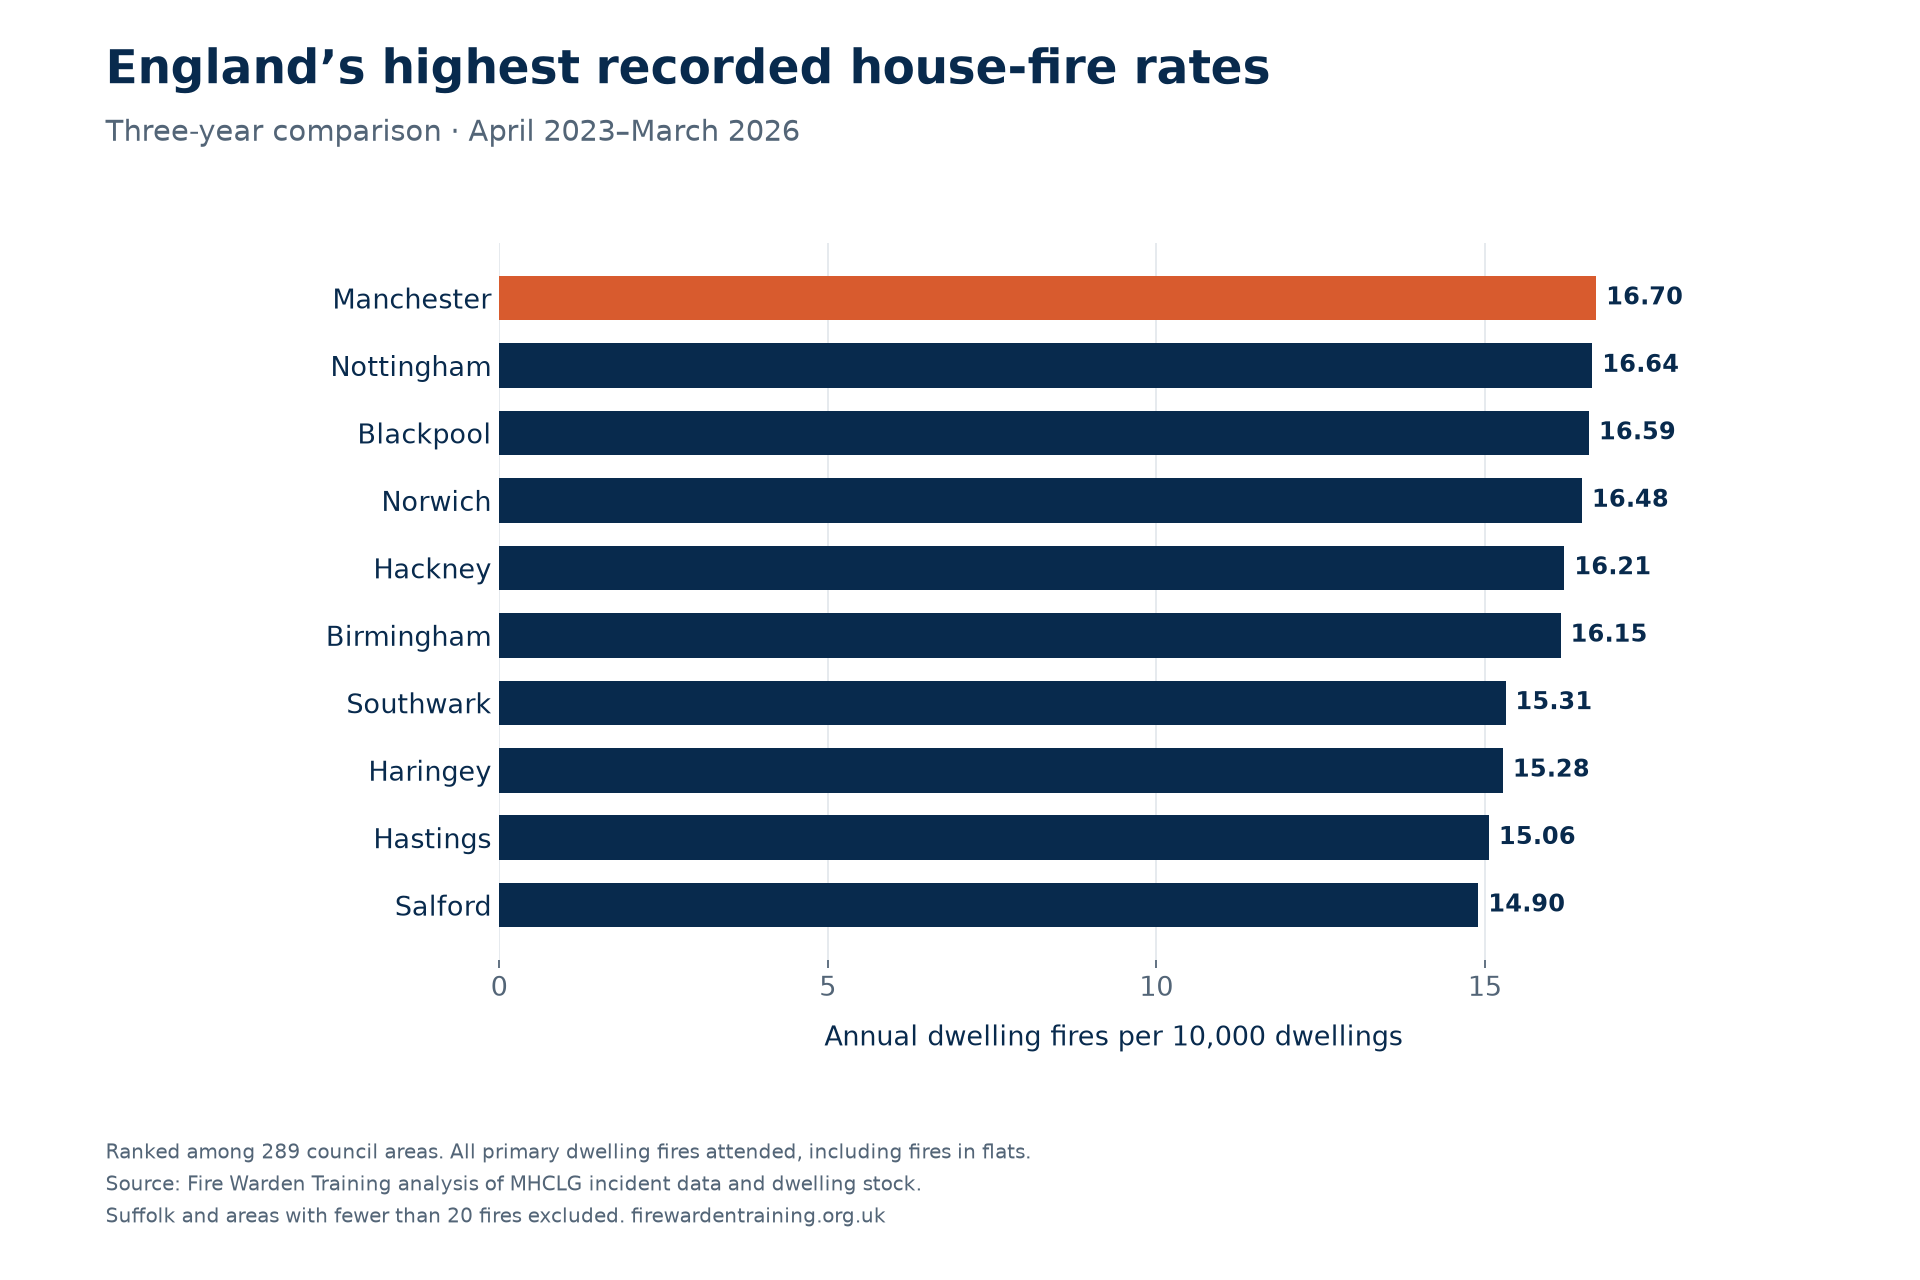
Manchester recorded 16.70 primary dwelling fires per 10,000 dwellings per year across 2023/24, 2024/25 and 2025/26. Nottingham followed at 16.64 and Blackpool at 16.59. The three areas’ rates are very close: their numerical positions should not be read as evidence of a meaningful difference in underlying risk.
At the other end of the table, Hart in Hampshire recorded 4.43, followed by East Cambridgeshire at 4.81 and Tonbridge and Malling at 5.04. These are the lowest recorded rates among the 289 areas that meet the study’s completeness and minimum-count rules.
The comparison covers fires in houses and flats attended by fire and rescue services, including accidental and deliberate fires. It measures incidents, not the number of households affected or the chance that an individual home will catch fire.
Highest recorded rates
Annual fires per 10,000 dwellings. Rank 1 is highest.
- 1Manchester1,208 fires over three years16.70
- 2Nottingham699 fires over three years16.64
- 3Blackpool365 fires over three years16.59
- 4Norwich339 fires over three years16.48
- 5Hackney580 fires over three years16.21
- 6Birmingham2,215 fires over three years16.15
- 7Southwark671 fires over three years15.31
- 8Haringey536 fires over three years15.28
- 9Hastings202 fires over three years15.06
- 10Salford594 fires over three years14.90
Lowest recorded rates
Shown from lowest upwards; national rank retained.
- 289Hart57 fires over three years4.43
- 288East Cambridgeshire59 fires over three years4.81
- 287Tonbridge and Malling86 fires over three years5.04
- 286Eastleigh95 fires over three years5.21
- 285Derbyshire Dales57 fires over three years5.26
- 284Hinckley and Bosworth84 fires over three years5.30
- 283South Cambridgeshire117 fires over three years5.30
- 282Tunbridge Wells84 fires over three years5.31
- 281Blaby78 fires over three years5.83
- 280Cheshire East334 fires over three years5.84
Why do some areas record more house fires?
Deprivation is one evidence-backed factor worth considering. Housing conditions, household circumstances and the types of fires occurring may also matter. Our ranking measures the differences; it does not establish what caused them.
Manchester: a higher rate, rather than the most fires
Manchester recorded 1,208 dwelling fires, compared with Birmingham’s 2,215. Manchester ranks higher after adjusting for the number of homes. Its rate of 16.70 is also only slightly above Nottingham’s 16.64 and Blackpool’s 16.59. Those small gaps do not demonstrate that one city is meaningfully more at risk than the others.
The 2025 Index of Multiple Deprivation places Manchester fourth, Nottingham twentieth and Blackpool first for deprivation on the council-level average-score measure. These are all among the 20 most deprived of England’s 296 council areas on that measure. Deprivation covers access to resources and opportunities, including income, employment, health and housing.
A 2026 study of Greater Manchester found around three times as many accidental dwelling fires per person in the most deprived neighbourhood group as in the least deprived group over 2013/14–2023/24. That supports deprivation as a possible part of the explanation. It covers the wider city region, an earlier period and accidental fires only, so it does not explain Manchester’s exact position in our ranking.
| Council area | Annual fires per 10,000 dwellings | Deprivation rank out of 296 |
|---|---|---|
| Manchester | 16.70 | 4 |
| Nottingham | 16.64 | 20 |
| Blackpool | 16.59 | 1 |
| Hart | 4.43 | 296 |
| East Cambridgeshire | 4.81 | 247 |
| Tonbridge and Malling | 5.04 | 233 |
Deprivation rank: 1 = most deprived; 296 = least deprived. Uses the IMD 2025 rank of average score, corrected File 10 v2, matched by May 2024 council code. Fire rates cover 2023/24–2025/26. These six examples were selected by their fire rates; this is not a test of the relationship across all councils. Download the comparison (CSV).
Hart and other lower-rate areas
Hart is the least deprived council area on the same measure, while East Cambridgeshire and Tonbridge and Malling are also towards the less-deprived end. Their lower recorded fire rates are consistent with the wider research, but that does not prove why each area sits near the bottom of this table.
Hart recorded 18, 22 and 17 fires in the three years. Its low rate is not simply a result of having fewer homes: the calculation already allows for housing stock. With relatively small counts, however, a handful of additional incidents can move an area’s rate and rank.
What might sit behind the pattern?
The Greater Manchester research discusses possible pathways such as difficulty replacing or maintaining older appliances and the use of less-safe heating options under financial pressure. These are possible mechanisms, not findings about the homes in our dataset. Identifying their contribution would require incident-level information about ignition sources, properties and household circumstances.
For national context, MHCLG’s 2025/26 analysis reports cooking appliances as the ignition source in 42% of accidental dwelling fires. Smoking materials accounted for 7.6% of those fires but 27% of associated fatalities. These England-wide figures are not a breakdown of Manchester’s incidents and show why fire frequency and fire severity need to be considered separately.
A fairer comparison than raw fire counts
Birmingham recorded 2,215 dwelling fires across the three years, compared with Manchester’s 1,208. But Birmingham also has substantially more homes. Dividing by housing stock puts Manchester’s recorded rate above Birmingham’s 16.15 per 10,000 dwellings.
Across the ranked areas, the combined annual rate is 10.08 per 10,000 dwellings. This benchmark is weighted by housing stock; it is not an average of the 289 council rates.
The map uses the same council boundaries for every year. Grey areas are excluded from the ranking, and the searchable table gives the reason.
Download the map (PNG)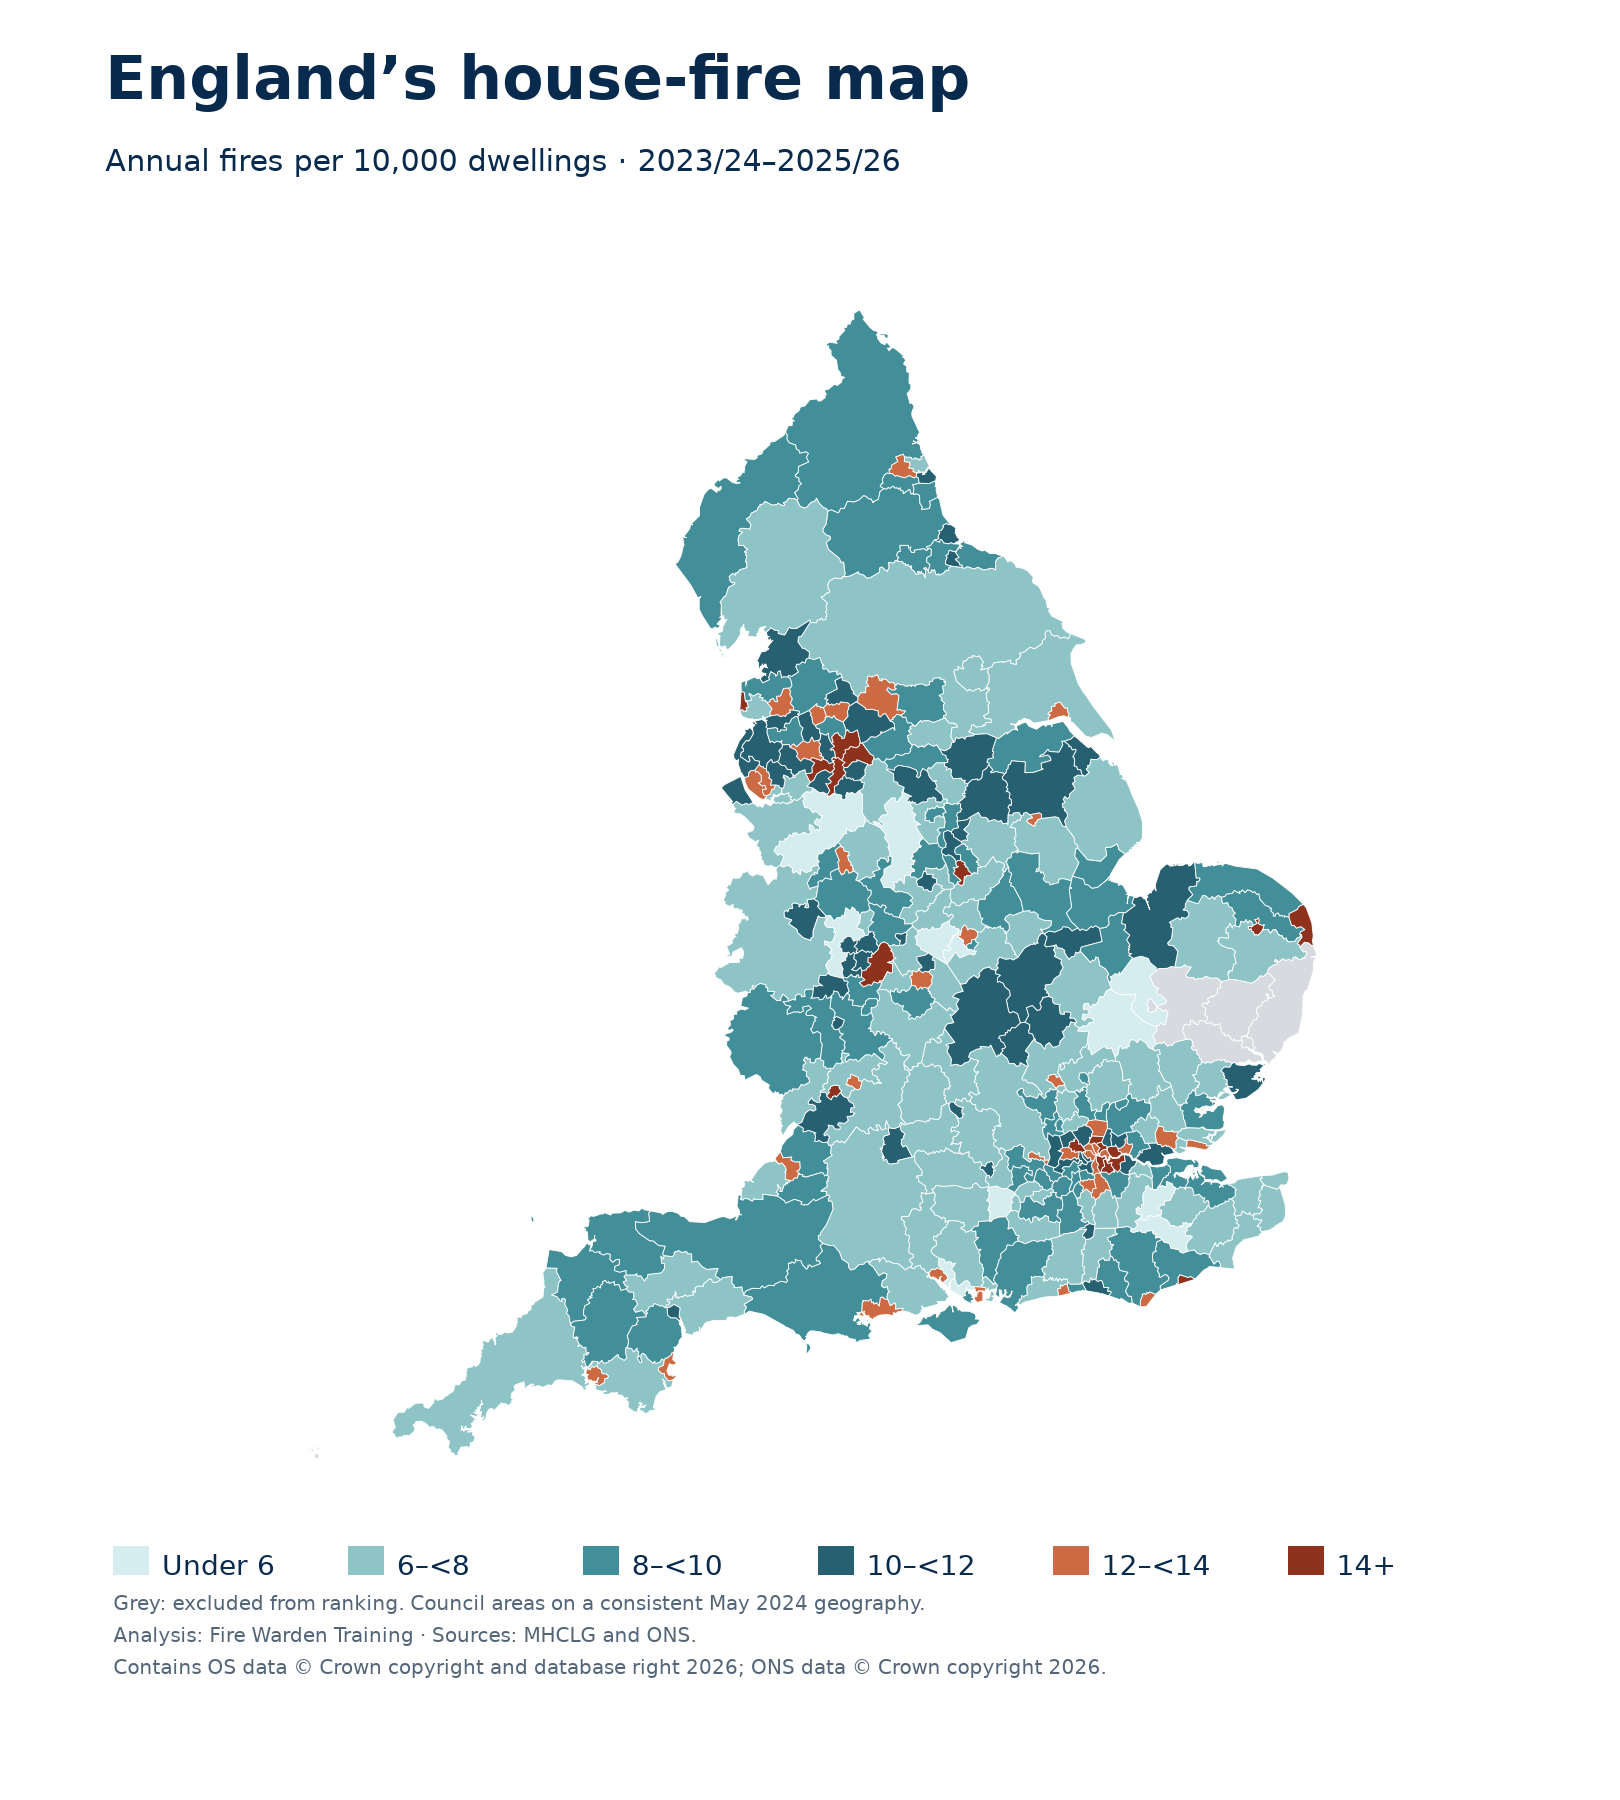
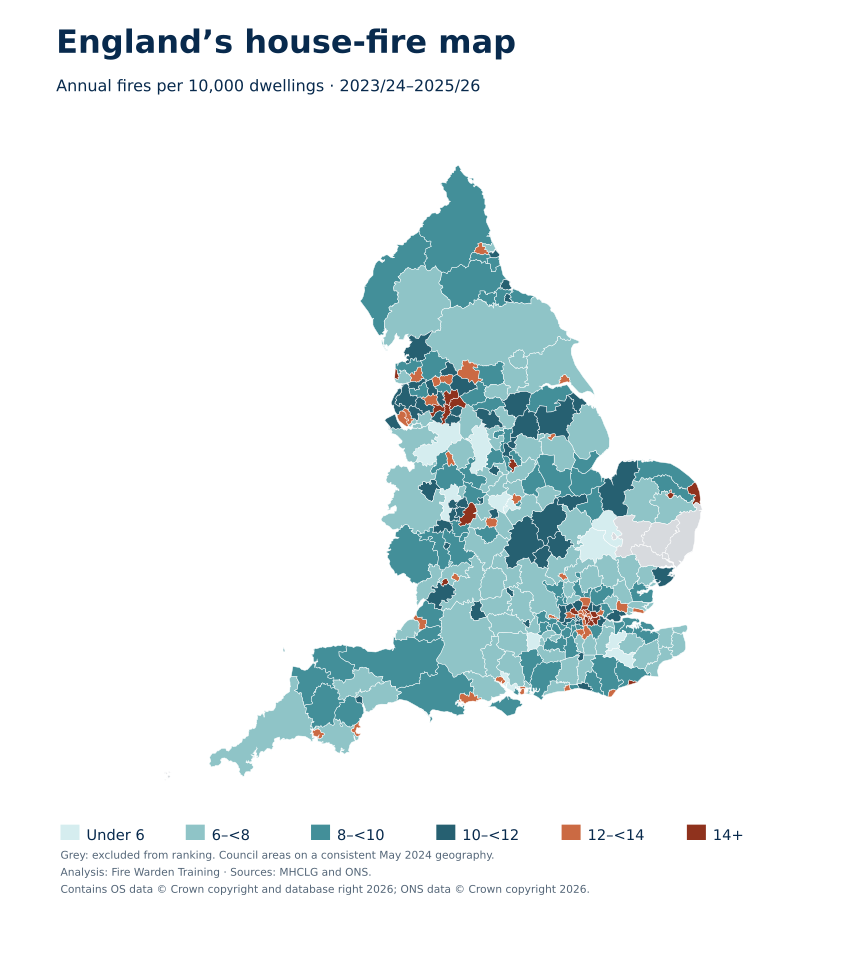
Explore England’s house-fire rates
Select an area to open its local profile. Use the dropdown below for small areas, including London boroughs.
Annual dwelling fires per 10,000 dwellings · 2023/24–2025/26
- Under 6
- 6–under 8
- 8–under 10
- 10–under 12
- 12–under 14
- 14 or more
- Not ranked
Contains OS data © Crown copyright and database right 2026; ONS data © Crown copyright 2026. Download a labelled map.
Your local fire profile
What might explain the differences between areas?
How the figures changed over three years
Annual rates use each year’s starting housing stock. The ranking uses all three years together. Changes are descriptive and do not establish a cause or statistical significance.
The ten highest recorded rates
The ten lowest recorded rates
Hart, East Cambridgeshire and Tonbridge and Malling lead the lower-rate end of the comparison. All ten areas below recorded rates at least 42% below the combined rate across ranked councils. This is a comparison of recorded incidents, not a measure of overall safety.
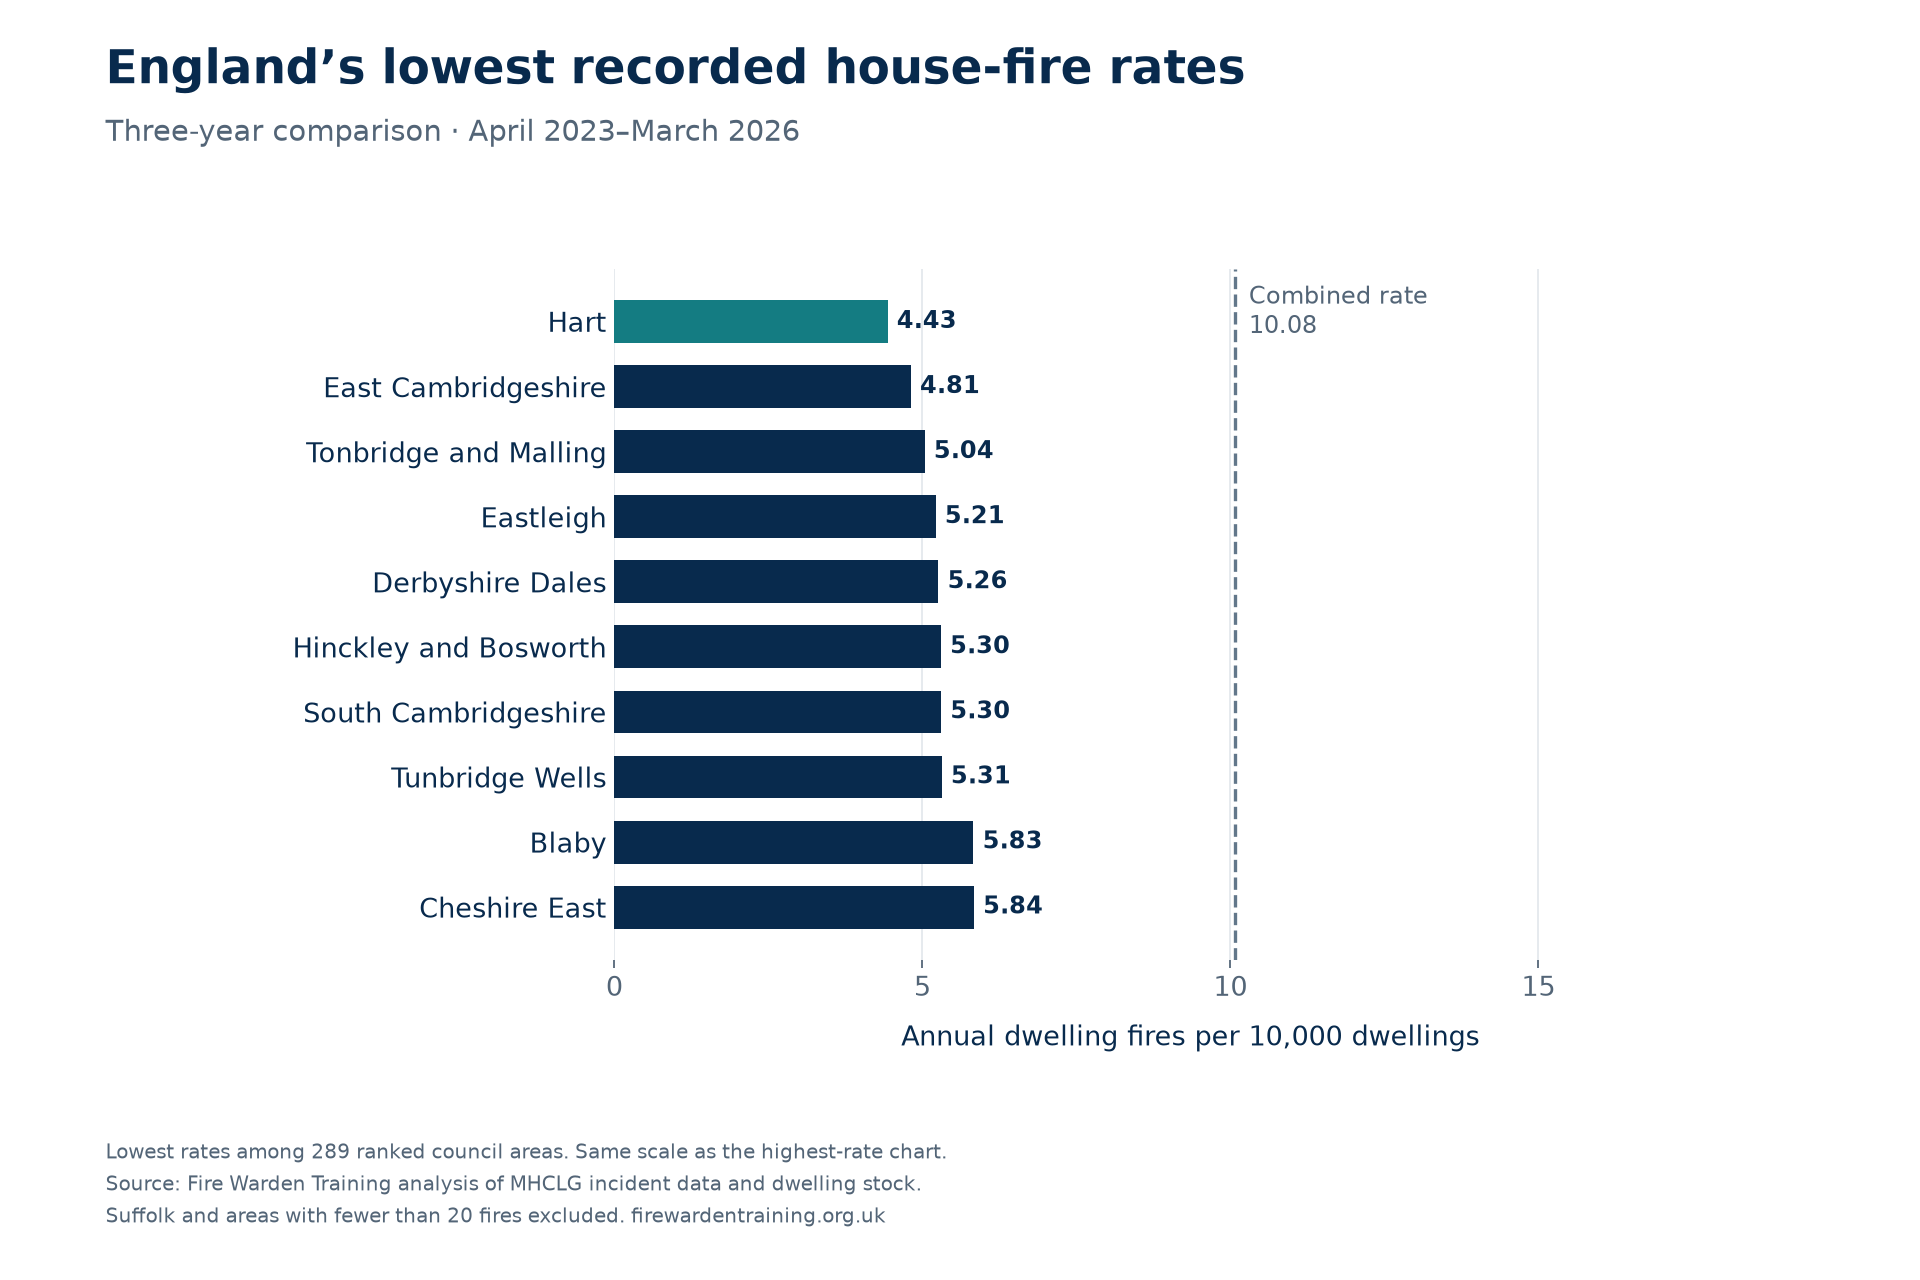
Download the lowest-rate chart (PNG) · SVG version · Lowest ten: full figures (CSV)
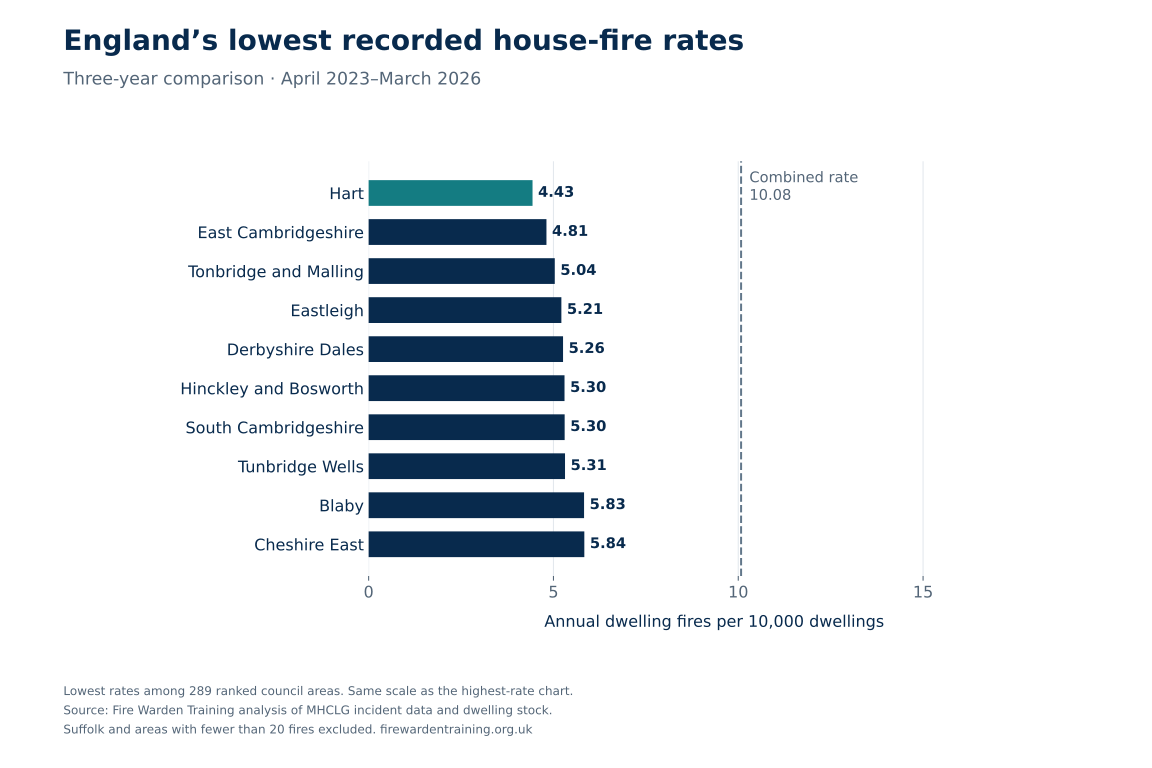
Find your council area
Search by council name or choose a region. Counts cover each financial year from April to March; the rate combines all three years.
Showing 296 council areas: 289 ranked and 7 excluded.
| Rank | Council area | Region | Fires 2023/24 | Fires 2024/25 | Fires 2025/26 | Three-year fires | Annual rate per 10,000 |
|---|---|---|---|---|---|---|---|
| 1 | Manchester | North West | 391 | 421 | 396 | 1,208 | 16.70 |
| 2 | Nottingham | East Midlands | 236 | 238 | 225 | 699 | 16.64 |
| 3 | Blackpool | North West | 117 | 113 | 135 | 365 | 16.59 |
| 4 | Norwich | East of England | 118 | 101 | 120 | 339 | 16.48 |
| 5 | Hackney | London | 195 | 176 | 209 | 580 | 16.21 |
| 6 | Birmingham | West Midlands | 713 | 778 | 724 | 2,215 | 16.15 |
| 7 | Southwark | London | 216 | 258 | 197 | 671 | 15.31 |
| 8 | Haringey | London | 160 | 175 | 201 | 536 | 15.28 |
| 9 | Hastings | South East | 77 | 65 | 60 | 202 | 15.06 |
| 10 | Salford | North West | 198 | 191 | 205 | 594 | 14.90 |
| 11 | Lewisham | London | 189 | 198 | 203 | 590 | 14.76 |
| 12 | Great Yarmouth | East of England | 59 | 88 | 75 | 222 | 14.70 |
| 13 | Oldham | North West | 152 | 142 | 138 | 432 | 14.51 |
| 14 | Brent | London | 192 | 196 | 193 | 581 | 14.38 |
| 15 | Newham | London | 192 | 194 | 183 | 569 | 14.24 |
| 16 | Gloucester | South West | 77 | 83 | 93 | 253 | 14.18 |
| 17 | Greenwich | London | 153 | 187 | 189 | 529 | 14.16 |
| 18 | Rochdale | North West | 135 | 137 | 142 | 414 | 14.12 |
| 19 | Islington | London | 162 | 147 | 145 | 454 | 13.95 |
| 20 | Burnley | North West | 52 | 67 | 59 | 178 | 13.87 |
| 21 | Luton | East of England | 116 | 112 | 121 | 349 | 13.86 |
| 22 | Stoke-on-Trent | West Midlands | 158 | 170 | 164 | 492 | 13.79 |
| 23 | Camden | London | 152 | 138 | 162 | 452 | 13.71 |
| 24 | Liverpool | North West | 324 | 310 | 313 | 947 | 13.56 |
| 25 | Croydon | London | 215 | 223 | 249 | 687 | 13.55 |
| 26 | Bristol, City of | South West | 293 | 280 | 271 | 844 | 13.52 |
| 27 | Newcastle upon Tyne | North East | 182 | 171 | 185 | 538 | 13.49 |
| 28 | Torbay | South West | 109 | 87 | 87 | 283 | 13.46 |
| 29 | Barking and Dagenham | London | 95 | 106 | 124 | 325 | 13.45 |
| 30 | Tower Hamlets | London | 216 | 181 | 174 | 571 | 13.36 |
| 31 | Slough | South East | 71 | 81 | 78 | 230 | 13.31 |
| 32 | Bolton | North West | 179 | 150 | 181 | 510 | 13.27 |
| 33 | Westminster | London | 164 | 201 | 162 | 527 | 13.23 |
| 34 | Hyndburn | North West | 54 | 49 | 46 | 149 | 13.13 |
| 35 | Coventry | West Midlands | 197 | 194 | 191 | 582 | 13.13 |
| 36 | Lambeth | London | 199 | 179 | 202 | 580 | 13.08 |
| 37 | Kingston upon Hull, City of | Yorkshire and the Humber | 158 | 169 | 160 | 487 | 13.02 |
| 38 | Eastbourne | South East | 65 | 58 | 72 | 195 | 13.01 |
| 39 | Lincoln | East Midlands | 60 | 58 | 59 | 177 | 12.95 |
| 40 | Plymouth | South West | 150 | 153 | 172 | 475 | 12.93 |
| 41 | Bradford | Yorkshire and the Humber | 285 | 272 | 299 | 856 | 12.77 |
| 42 | Worthing | South East | 71 | 62 | 66 | 199 | 12.69 |
| 43 | Southend-on-Sea | East of England | 104 | 97 | 115 | 316 | 12.60 |
| 44 | Preston | North West | 86 | 88 | 79 | 253 | 12.53 |
| 45 | Knowsley | North West | 83 | 97 | 87 | 267 | 12.45 |
| 46 | Portsmouth | South East | 121 | 120 | 100 | 341 | 12.43 |
| 47 | Ealing | London | 174 | 170 | 202 | 546 | 12.42 |
| 48 | Bournemouth, Christchurch and Poole | South West | 236 | 199 | 261 | 696 | 12.30 |
| 49 | Cheltenham | South West | 77 | 72 | 63 | 212 | 12.29 |
| 50 | Enfield | London | 166 | 150 | 160 | 476 | 12.16 |
| 51 | Leicester | East Midlands | 163 | 187 | 152 | 502 | 12.14 |
| 52 | Sutton | London | 106 | 102 | 105 | 313 | 12.05 |
| 53 | Basildon | East of England | 87 | 109 | 94 | 290 | 12.04 |
| 54 | Southampton | South East | 124 | 138 | 132 | 394 | 12.01 |
| 55 | Sandwell | West Midlands | 151 | 170 | 169 | 490 | 11.98 |
| 56 | Hounslow | London | 126 | 126 | 151 | 403 | 11.95 |
| 57 | King's Lynn and West Norfolk | East of England | 96 | 86 | 91 | 273 | 11.93 |
| 58 | Wirral | North West | 182 | 182 | 182 | 546 | 11.91 |
| 59 | Hammersmith and Fulham | London | 100 | 113 | 136 | 349 | 11.86 |
| 60 | Waltham Forest | London | 139 | 129 | 125 | 393 | 11.77 |
| 61 | Redbridge | London | 121 | 116 | 145 | 382 | 11.74 |
| 62 | Sheffield | Yorkshire and the Humber | 315 | 289 | 280 | 884 | 11.74 |
| 63 | Exeter | South West | 72 | 73 | 57 | 202 | 11.71 |
| 64 | Crawley | South East | 53 | 62 | 51 | 166 | 11.68 |
| 65 | Reading | South East | 88 | 98 | 75 | 261 | 11.63 |
| 66 | Brighton and Hove | South East | 170 | 139 | 156 | 465 | 11.55 |
| 67 | Wyre Forest | West Midlands | 67 | 57 | 47 | 171 | 11.54 |
| 68 | Wolverhampton | West Midlands | 126 | 138 | 133 | 397 | 11.50 |
| 69 | Barnet | London | 200 | 169 | 190 | 559 | 11.45 |
| 70 | Blackburn with Darwen | North West | 76 | 71 | 71 | 218 | 11.40 |
| 71 | Stockport | North West | 151 | 149 | 152 | 452 | 11.33 |
| 72 | Peterborough | East of England | 115 | 90 | 103 | 308 | 11.33 |
| 73 | South Tyneside | North East | 87 | 78 | 82 | 247 | 11.32 |
| 74 | Nuneaton and Bedworth | West Midlands | 70 | 55 | 83 | 208 | 11.30 |
| 75 | Tendring | East of England | 95 | 87 | 72 | 254 | 11.26 |
| 76 | Milton Keynes | South East | 136 | 144 | 140 | 420 | 11.23 |
| 77 | Hillingdon | London | 121 | 143 | 132 | 396 | 11.20 |
| 78 | North Northamptonshire | East Midlands | 165 | 169 | 200 | 534 | 11.09 |
| 79 | Trafford | North West | 110 | 101 | 130 | 341 | 11.06 |
| 80 | Calderdale | Yorkshire and the Humber | 113 | 99 | 108 | 320 | 10.94 |
| 81 | Lancaster | North West | 66 | 83 | 68 | 217 | 10.92 |
| 82 | Worcester | West Midlands | 60 | 49 | 47 | 156 | 10.91 |
| 83 | Tameside | North West | 89 | 136 | 120 | 345 | 10.90 |
| 84 | Doncaster | Yorkshire and the Humber | 145 | 158 | 168 | 471 | 10.90 |
| 85 | West Northamptonshire | East Midlands | 178 | 203 | 227 | 608 | 10.90 |
| 86 | Sefton | North West | 137 | 153 | 138 | 428 | 10.78 |
| 87 | Thurrock | East of England | 68 | 62 | 97 | 227 | 10.73 |
| 88 | Bury | North West | 85 | 91 | 99 | 275 | 10.73 |
| 89 | Derby | East Midlands | 118 | 136 | 112 | 366 | 10.66 |
| 90 | West Lindsey | East Midlands | 53 | 54 | 42 | 149 | 10.66 |
| 91 | Pendle | North West | 44 | 46 | 43 | 133 | 10.63 |
| 92 | Middlesbrough | North East | 72 | 68 | 69 | 209 | 10.61 |
| 93 | Wigan | North West | 157 | 159 | 171 | 487 | 10.61 |
| 94 | Mansfield | East Midlands | 65 | 52 | 47 | 164 | 10.59 |
| 95 | Oxford | South East | 69 | 56 | 66 | 191 | 10.57 |
| 96 | Telford and Wrekin | West Midlands | 95 | 80 | 89 | 264 | 10.50 |
| 97 | Stroud | South West | 65 | 50 | 64 | 179 | 10.49 |
| 98 | Harrow | London | 97 | 94 | 112 | 303 | 10.44 |
| 99 | Wandsworth | London | 185 | 153 | 153 | 491 | 10.44 |
| 100 | North East Lincolnshire | Yorkshire and the Humber | 79 | 64 | 93 | 236 | 10.43 |
| 101 | Hartlepool | North East | 49 | 42 | 50 | 141 | 10.28 |
| 102 | Kensington and Chelsea | London | 91 | 90 | 96 | 277 | 10.26 |
| 103 | Swindon | South West | 89 | 95 | 132 | 316 | 10.25 |
| 104 | Walsall | West Midlands | 138 | 101 | 126 | 365 | 10.25 |
| 105 | Bassetlaw | East Midlands | 59 | 70 | 46 | 175 | 10.21 |
| 106 | St. Helens | North West | 80 | 98 | 86 | 264 | 10.21 |
| 107 | Dudley | West Midlands | 148 | 137 | 146 | 431 | 10.15 |
| 108 | Bexley | London | 100 | 101 | 107 | 308 | 10.14 |
| 109 | Ashfield | East Midlands | 57 | 59 | 60 | 176 | 10.13 |
| 110 | South Ribble | North West | 51 | 48 | 60 | 159 | 10.12 |
| 111 | Tamworth | West Midlands | 31 | 37 | 38 | 106 | 10.12 |
| 112 | West Lancashire | North West | 54 | 46 | 60 | 160 | 10.11 |
| 113 | Bedford | East of England | 76 | 87 | 83 | 246 | 10.08 |
| 114 | Sunderland | North East | 146 | 135 | 118 | 399 | 9.99 |
| 115 | Boston | East Midlands | 31 | 31 | 33 | 95 | 9.94 |
| 116 | Merton | London | 90 | 85 | 87 | 262 | 9.89 |
| 117 | Redditch | West Midlands | 25 | 41 | 47 | 113 | 9.86 |
| 118 | Havering | London | 104 | 111 | 103 | 318 | 9.74 |
| 119 | Kirklees | Yorkshire and the Humber | 184 | 168 | 205 | 557 | 9.73 |
| 120 | Gateshead | North East | 89 | 93 | 96 | 278 | 9.72 |
| 121 | Harlow | East of England | 44 | 35 | 39 | 118 | 9.69 |
| 122 | Fenland | East of England | 47 | 48 | 44 | 139 | 9.68 |
| 123 | Leeds | Yorkshire and the Humber | 346 | 379 | 341 | 1,066 | 9.66 |
| 124 | Isle of Wight | South East | 64 | 80 | 71 | 215 | 9.61 |
| 125 | Rother | South East | 47 | 39 | 50 | 136 | 9.60 |
| 126 | Stevenage | East of England | 40 | 41 | 29 | 110 | 9.57 |
| 127 | Epsom and Ewell | South East | 30 | 29 | 36 | 95 | 9.55 |
| 128 | Rossendale | North West | 27 | 35 | 32 | 94 | 9.55 |
| 129 | West Devon | South West | 31 | 21 | 26 | 78 | 9.50 |
| 130 | Lewes | South East | 58 | 36 | 41 | 135 | 9.47 |
| 131 | Adur | South East | 31 | 19 | 32 | 82 | 9.40 |
| 132 | Stafford | West Midlands | 64 | 63 | 54 | 181 | 9.39 |
| 133 | Wyre | North West | 59 | 43 | 56 | 158 | 9.37 |
| 134 | Redcar and Cleveland | North East | 57 | 60 | 71 | 188 | 9.37 |
| 135 | Kingston upon Thames | London | 72 | 67 | 58 | 197 | 9.34 |
| 136 | Bath and North East Somerset | South West | 76 | 87 | 77 | 240 | 9.33 |
| 137 | Spelthorne | South East | 44 | 36 | 43 | 123 | 9.23 |
| 138 | Bromley | London | 128 | 132 | 133 | 393 | 9.17 |
| 139 | Dacorum | East of England | 71 | 62 | 53 | 186 | 9.13 |
| 140 | Chesterfield | East Midlands | 44 | 51 | 44 | 139 | 9.08 |
| 141 | Gravesham | South East | 38 | 42 | 43 | 123 | 9.05 |
| 142 | Broxtowe | East Midlands | 47 | 43 | 50 | 140 | 9.04 |
| 143 | Barnsley | Yorkshire and the Humber | 104 | 108 | 100 | 312 | 9.00 |
| 144 | North Devon | South West | 36 | 44 | 55 | 135 | 8.92 |
| 145 | North Norfolk | East of England | 52 | 41 | 61 | 154 | 8.90 |
| 146 | Three Rivers | East of England | 26 | 42 | 36 | 104 | 8.88 |
| 147 | Welwyn Hatfield | East of England | 54 | 47 | 31 | 132 | 8.87 |
| 148 | Richmond upon Thames | London | 67 | 91 | 70 | 228 | 8.83 |
| 149 | Stockton-on-Tees | North East | 72 | 65 | 101 | 238 | 8.81 |
| 150 | Chichester | South East | 59 | 50 | 54 | 163 | 8.76 |
| 151 | Gosport | South East | 36 | 34 | 29 | 99 | 8.72 |
| 152 | Ribble Valley | North West | 33 | 19 | 27 | 79 | 8.72 |
| 153 | Wychavon | West Midlands | 46 | 60 | 55 | 161 | 8.69 |
| 154 | Elmbridge | South East | 59 | 43 | 55 | 157 | 8.67 |
| 155 | East Hampshire | South East | 43 | 41 | 62 | 146 | 8.66 |
| 156 | Herefordshire, County of | West Midlands | 74 | 69 | 91 | 234 | 8.59 |
| 157 | Maldon | East of England | 26 | 23 | 29 | 78 | 8.58 |
| 158 | Dorset | South West | 142 | 157 | 186 | 485 | 8.57 |
| 159 | Epping Forest | East of England | 51 | 46 | 53 | 150 | 8.57 |
| 160 | Bromsgrove | West Midlands | 38 | 35 | 38 | 111 | 8.55 |
| 161 | Lichfield | West Midlands | 38 | 51 | 37 | 126 | 8.53 |
| 162 | Newcastle-under-Lyme | West Midlands | 60 | 43 | 44 | 147 | 8.53 |
| 163 | Chorley | North West | 48 | 44 | 44 | 136 | 8.52 |
| 164 | Broadland | East of England | 46 | 44 | 69 | 159 | 8.51 |
| 165 | Cumberland | North West | 110 | 125 | 118 | 353 | 8.46 |
| 166 | Somerset | South West | 236 | 216 | 239 | 691 | 8.46 |
| 167 | South Kesteven | East Midlands | 43 | 69 | 59 | 171 | 8.45 |
| 168 | County Durham | North East | 213 | 203 | 223 | 639 | 8.43 |
| 169 | Gedling | East Midlands | 44 | 43 | 52 | 139 | 8.41 |
| 170 | Teignbridge | South West | 60 | 57 | 49 | 166 | 8.41 |
| 171 | Malvern Hills | West Midlands | 40 | 34 | 22 | 96 | 8.41 |
| 172 | Guildford | South East | 59 | 47 | 48 | 154 | 8.40 |
| 173 | Oadby and Wigston | East Midlands | 20 | 22 | 19 | 61 | 8.37 |
| 174 | North Lincolnshire | Yorkshire and the Humber | 59 | 63 | 73 | 195 | 8.37 |
| 175 | Mole Valley | South East | 31 | 37 | 31 | 99 | 8.33 |
| 176 | South Holland | East Midlands | 36 | 35 | 40 | 111 | 8.32 |
| 177 | Runnymede | South East | 33 | 33 | 30 | 96 | 8.31 |
| 178 | Wealden | South East | 62 | 59 | 65 | 186 | 8.28 |
| 179 | Broxbourne | East of England | 28 | 40 | 38 | 106 | 8.27 |
| 180 | Medway | South East | 99 | 108 | 92 | 299 | 8.26 |
| 181 | Torridge | South West | 26 | 32 | 28 | 86 | 8.25 |
| 182 | Windsor and Maidenhead | South East | 48 | 54 | 62 | 164 | 8.22 |
| 183 | Bolsover | East Midlands | 35 | 30 | 30 | 95 | 8.19 |
| 184 | Warwick | West Midlands | 48 | 52 | 69 | 169 | 8.17 |
| 185 | Darlington | North East | 42 | 47 | 41 | 130 | 8.10 |
| 186 | Bracknell Forest | South East | 39 | 43 | 50 | 132 | 8.09 |
| 187 | Watford | East of England | 31 | 36 | 39 | 106 | 8.09 |
| 188 | Melton | East Midlands | 23 | 16 | 21 | 60 | 8.09 |
| 189 | Northumberland | North East | 136 | 126 | 135 | 397 | 8.08 |
| 190 | Amber Valley | East Midlands | 44 | 54 | 48 | 146 | 8.05 |
| 191 | South Gloucestershire | South West | 86 | 106 | 116 | 308 | 8.05 |
| 192 | East Staffordshire | West Midlands | 43 | 39 | 53 | 135 | 8.04 |
| 193 | Swale | South East | 54 | 58 | 53 | 165 | 8.00 |
| 194 | Arun | South East | 68 | 67 | 55 | 190 | 7.98 |
| 195 | North Kesteven | East Midlands | 34 | 45 | 51 | 130 | 7.93 |
| 196 | Castle Point | East of England | 28 | 33 | 32 | 93 | 7.93 |
| 197 | Cornwall | South West | 239 | 231 | 224 | 694 | 7.88 |
| 198 | South Hams | South West | 44 | 34 | 36 | 114 | 7.87 |
| 199 | Rotherham | Yorkshire and the Humber | 102 | 99 | 85 | 286 | 7.82 |
| 200 | West Oxfordshire | South East | 47 | 39 | 39 | 125 | 7.81 |
| 201 | Colchester | East of England | 59 | 59 | 83 | 201 | 7.80 |
| 202 | Tandridge | South East | 33 | 26 | 30 | 89 | 7.78 |
| 203 | Solihull | West Midlands | 74 | 61 | 89 | 224 | 7.78 |
| 204 | Cannock Chase | West Midlands | 33 | 32 | 42 | 107 | 7.74 |
| 205 | Westmorland and Furness | North West | 80 | 95 | 106 | 281 | 7.74 |
| 206 | Forest of Dean | South West | 29 | 23 | 43 | 95 | 7.73 |
| 207 | Chelmsford | East of England | 53 | 66 | 69 | 188 | 7.72 |
| 208 | North Tyneside | North East | 87 | 67 | 81 | 235 | 7.71 |
| 209 | Mid Sussex | South East | 55 | 59 | 46 | 160 | 7.69 |
| 210 | Cambridge | East of England | 41 | 57 | 36 | 134 | 7.67 |
| 211 | Breckland | East of England | 64 | 47 | 40 | 151 | 7.65 |
| 212 | Erewash | East Midlands | 46 | 43 | 33 | 122 | 7.65 |
| 213 | Shropshire | West Midlands | 132 | 107 | 110 | 349 | 7.65 |
| 214 | North Warwickshire | West Midlands | 27 | 20 | 21 | 68 | 7.62 |
| 215 | North Somerset | South West | 73 | 84 | 77 | 234 | 7.59 |
| 216 | Wakefield | Yorkshire and the Humber | 113 | 133 | 129 | 375 | 7.58 |
| 217 | Mid Devon | South West | 26 | 33 | 28 | 87 | 7.56 |
| 218 | Stratford-on-Avon | West Midlands | 62 | 41 | 49 | 152 | 7.51 |
| 219 | Charnwood | East Midlands | 49 | 53 | 76 | 178 | 7.51 |
| 220 | Halton | North West | 49 | 47 | 37 | 133 | 7.48 |
| 221 | South Norfolk | East of England | 48 | 56 | 46 | 150 | 7.48 |
| 222 | Havant | South East | 55 | 47 | 26 | 128 | 7.47 |
| 223 | Newark and Sherwood | East Midlands | 48 | 45 | 37 | 130 | 7.46 |
| 224 | Wiltshire | South West | 172 | 144 | 198 | 514 | 7.39 |
| 225 | Horsham | South East | 59 | 46 | 42 | 147 | 7.39 |
| 226 | Thanet | South East | 44 | 50 | 63 | 157 | 7.37 |
| 227 | Woking | South East | 40 | 23 | 36 | 99 | 7.36 |
| 228 | Vale of White Horse | South East | 42 | 44 | 55 | 141 | 7.33 |
| 229 | West Berkshire | South East | 51 | 54 | 52 | 157 | 7.33 |
| 230 | Hertsmere | East of England | 34 | 25 | 41 | 100 | 7.32 |
| 231 | Dover | South East | 40 | 38 | 46 | 124 | 7.31 |
| 232 | Basingstoke and Deane | South East | 57 | 57 | 64 | 178 | 7.28 |
| 233 | Rushcliffe | East Midlands | 34 | 44 | 42 | 120 | 7.25 |
| 234 | Surrey Heath | South East | 24 | 34 | 26 | 84 | 7.25 |
| 235 | Reigate and Banstead | South East | 42 | 53 | 44 | 139 | 7.21 |
| 236 | Central Bedfordshire | East of England | 92 | 105 | 88 | 285 | 7.20 |
| 237 | High Peak | East Midlands | 32 | 33 | 30 | 95 | 7.16 |
| 238 | Buckinghamshire | South East | 167 | 170 | 176 | 513 | 7.16 |
| 239 | Braintree | East of England | 50 | 48 | 52 | 150 | 7.14 |
| 240 | Warrington | North West | 71 | 72 | 64 | 207 | 7.11 |
| 241 | East Hertfordshire | East of England | 52 | 43 | 49 | 144 | 7.11 |
| 242 | Waverley | South East | 48 | 27 | 47 | 122 | 7.09 |
| 243 | Canterbury | South East | 44 | 44 | 61 | 149 | 7.08 |
| 244 | Wokingham | South East | 50 | 46 | 62 | 158 | 7.06 |
| 245 | Maidstone | South East | 52 | 62 | 53 | 167 | 7.03 |
| 246 | North Hertfordshire | East of England | 46 | 35 | 44 | 125 | 6.94 |
| 247 | York | Yorkshire and the Humber | 70 | 59 | 62 | 191 | 6.91 |
| 248 | Uttlesford | East of England | 31 | 25 | 28 | 84 | 6.91 |
| 249 | Rugby | West Midlands | 30 | 41 | 37 | 108 | 6.90 |
| 250 | North West Leicestershire | East Midlands | 35 | 35 | 31 | 101 | 6.87 |
| 251 | South Derbyshire | East Midlands | 28 | 40 | 36 | 104 | 6.85 |
| 252 | North East Derbyshire | East Midlands | 24 | 33 | 43 | 100 | 6.78 |
| 253 | East Lindsey | East Midlands | 56 | 63 | 63 | 182 | 6.74 |
| 254 | Cotswold | South West | 27 | 34 | 33 | 94 | 6.73 |
| 255 | Rushmoor | South East | 39 | 28 | 18 | 85 | 6.70 |
| 256 | Fylde | North West | 23 | 31 | 30 | 84 | 6.69 |
| 257 | Rutland | East Midlands | 12 | 15 | 9 | 36 | 6.68 |
| 258 | Brentwood | East of England | 24 | 22 | 25 | 71 | 6.67 |
| 259 | Staffordshire Moorlands | West Midlands | 35 | 27 | 29 | 91 | 6.67 |
| 260 | Cherwell | South East | 44 | 42 | 58 | 144 | 6.62 |
| 261 | Harborough | East Midlands | 36 | 33 | 19 | 88 | 6.59 |
| 262 | Rochford | East of England | 25 | 26 | 24 | 75 | 6.59 |
| 263 | Tewkesbury | South West | 28 | 30 | 33 | 91 | 6.59 |
| 264 | East Devon | South West | 51 | 57 | 40 | 148 | 6.57 |
| 265 | Dartford | South East | 43 | 35 | 20 | 98 | 6.55 |
| 266 | Sevenoaks | South East | 26 | 35 | 41 | 102 | 6.51 |
| 267 | St Albans | East of England | 36 | 34 | 53 | 123 | 6.49 |
| 268 | North Yorkshire | Yorkshire and the Humber | 209 | 197 | 194 | 600 | 6.48 |
| 269 | Test Valley | South East | 39 | 28 | 46 | 113 | 6.42 |
| 270 | Winchester | South East | 36 | 37 | 37 | 110 | 6.37 |
| 271 | Folkestone and Hythe | South East | 37 | 34 | 32 | 103 | 6.31 |
| 272 | Ashford | South East | 20 | 33 | 58 | 111 | 6.29 |
| 273 | New Forest | South East | 49 | 56 | 51 | 156 | 6.18 |
| 274 | South Oxfordshire | South East | 41 | 44 | 40 | 125 | 6.16 |
| 275 | East Riding of Yorkshire | Yorkshire and the Humber | 110 | 85 | 132 | 327 | 6.09 |
| 276 | Cheshire West and Chester | North West | 92 | 108 | 101 | 301 | 6.02 |
| 277 | Huntingdonshire | East of England | 54 | 57 | 39 | 150 | 6.00 |
| 278 | South Staffordshire | West Midlands | 31 | 30 | 27 | 88 | 5.94 |
| 279 | Fareham | South East | 32 | 32 | 27 | 91 | 5.94 |
| 280 | Cheshire East | North West | 115 | 114 | 105 | 334 | 5.84 |
| 281 | Blaby | East Midlands | 28 | 23 | 27 | 78 | 5.83 |
| 282 | Tunbridge Wells | South East | 21 | 33 | 30 | 84 | 5.31 |
| 283 | South Cambridgeshire | East of England | 32 | 50 | 35 | 117 | 5.30 |
| 284 | Hinckley and Bosworth | East Midlands | 26 | 30 | 28 | 84 | 5.30 |
| 285 | Derbyshire Dales | East Midlands | 25 | 21 | 11 | 57 | 5.26 |
| 286 | Eastleigh | South East | 35 | 28 | 32 | 95 | 5.21 |
| 287 | Tonbridge and Malling | South East | 24 | 35 | 27 | 86 | 5.04 |
| 288 | East Cambridgeshire | East of England | 22 | 21 | 16 | 59 | 4.81 |
| 289 | Hart | South East | 18 | 22 | 17 | 57 | 4.43 |
| — | BaberghIncomplete Suffolk records | East of England | 34 | 38 | 31 | 103 | Not ranked |
| — | City of LondonFewer than 20 fires in three years | London | 1 | 6 | 5 | 12 | Not ranked |
| — | East SuffolkIncomplete Suffolk records | East of England | 100 | 85 | 100 | 285 | Not ranked |
| — | IpswichIncomplete Suffolk records | East of England | 97 | 57 | 78 | 232 | Not ranked |
| — | Isles of ScillyFewer than 20 fires in three years | South West | 0 | 3 | 1 | 4 | Not ranked |
| — | Mid SuffolkIncomplete Suffolk records | East of England | 35 | 37 | 30 | 102 | Not ranked |
| — | West SuffolkIncomplete Suffolk records | East of England | 69 | 57 | 54 | 180 | Not ranked |
No matching councils. Try a shorter name or select all regions.
Rank uses unrounded rates; displayed rates have two decimal places. Excluded Suffolk counts are incomplete. Excluded small-area counts are shown for context. On smaller screens, scroll the table sideways.
Where recorded house-fire rates rose and fell
The highest three-year rate and the largest recent increase answer different questions. This comparison uses the first and last years of the study, 2023/24 and 2025/26, to show where recorded rates changed most.
Swindon had the largest increase among the 162 areas in this comparison: from 8.73 to 12.75 fires per 10,000 dwellings, a rise of 4.02. Its recorded fires increased from 89 to 132. Thurrock followed, with a rate increase of 3.98, from 9.71 to 13.69.
Hastings had the largest fall among the eligible areas: from 17.32 to 13.33 fires per 10,000 dwellings, a decrease of 3.99. Its count fell from 77 to 60. Tendring followed, with a decrease of 3.31, from 12.77 to 9.46.
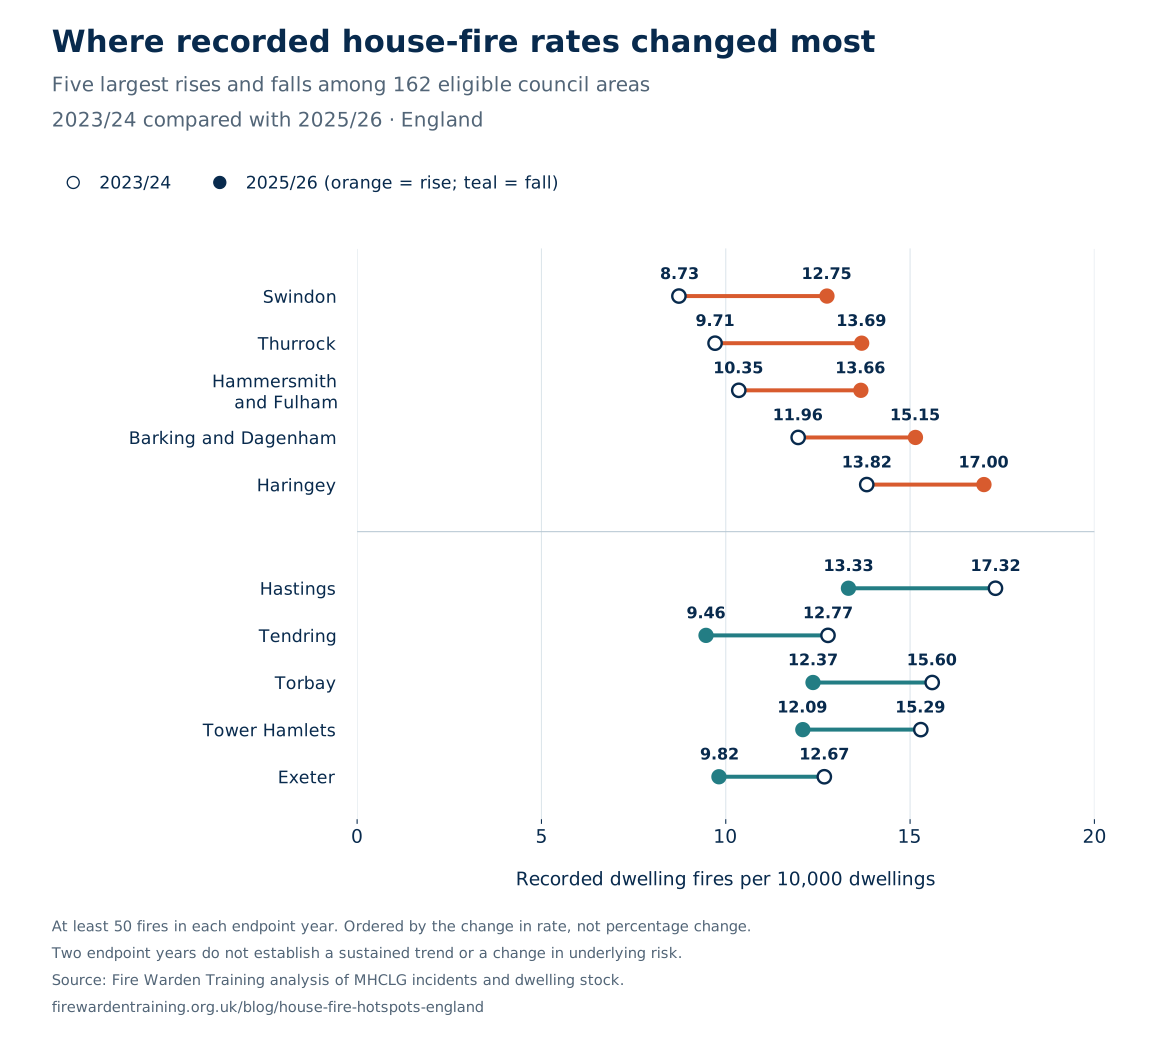
On small screens, scroll the chart and tables sideways to read every label.
The ten largest recorded rises
| Council area | Fires 2023/24 | Fires 2025/26 | Rate 2023/24 | Rate 2025/26 | Rate change |
|---|---|---|---|---|---|
| Swindon | 89 | 132 | 8.73 | 12.75 | +4.02 |
| Thurrock | 68 | 97 | 9.71 | 13.69 | +3.98 |
| Hammersmith and Fulham | 100 | 136 | 10.35 | 13.66 | +3.31 |
| Barking and Dagenham | 95 | 124 | 11.96 | 15.15 | +3.18 |
| Haringey | 160 | 201 | 13.82 | 17.00 | +3.18 |
| Stockton-on-Tees | 72 | 101 | 8.05 | 11.12 | +3.07 |
| Great Yarmouth | 59 | 75 | 11.80 | 14.80 | +3.00 |
| Tameside | 89 | 120 | 8.48 | 11.32 | +2.84 |
| Colchester | 59 | 83 | 6.95 | 9.58 | +2.63 |
| Greenwich | 153 | 189 | 12.39 | 15.01 | +2.62 |
The ten largest recorded falls
| Council area | Fires 2023/24 | Fires 2025/26 | Rate 2023/24 | Rate 2025/26 | Rate change |
|---|---|---|---|---|---|
| Hastings | 77 | 60 | 17.32 | 13.33 | -3.99 |
| Tendring | 95 | 72 | 12.77 | 9.46 | -3.31 |
| Torbay | 109 | 87 | 15.60 | 12.37 | -3.23 |
| Tower Hamlets | 216 | 174 | 15.29 | 12.09 | -3.20 |
| Exeter | 72 | 57 | 12.67 | 9.82 | -2.86 |
| Dacorum | 71 | 53 | 10.53 | 7.75 | -2.78 |
| Cheltenham | 77 | 63 | 13.46 | 10.90 | -2.57 |
| Portsmouth | 121 | 100 | 13.25 | 10.92 | -2.34 |
| Wandsworth | 185 | 153 | 11.97 | 9.64 | -2.34 |
| Sunderland | 146 | 118 | 11.03 | 8.81 | -2.22 |
Counts, housing stock and annual variation all affect this comparison. Two endpoint years cannot establish a sustained trend, and a fall cannot be attributed to a particular local policy from these data. These are recorded changes, not proof of a change in a household’s underlying risk. Use the local profile to see the middle year as well.
Download the rate-change data (CSV) · Download the chart (PNG) · Download the chart (SVG)
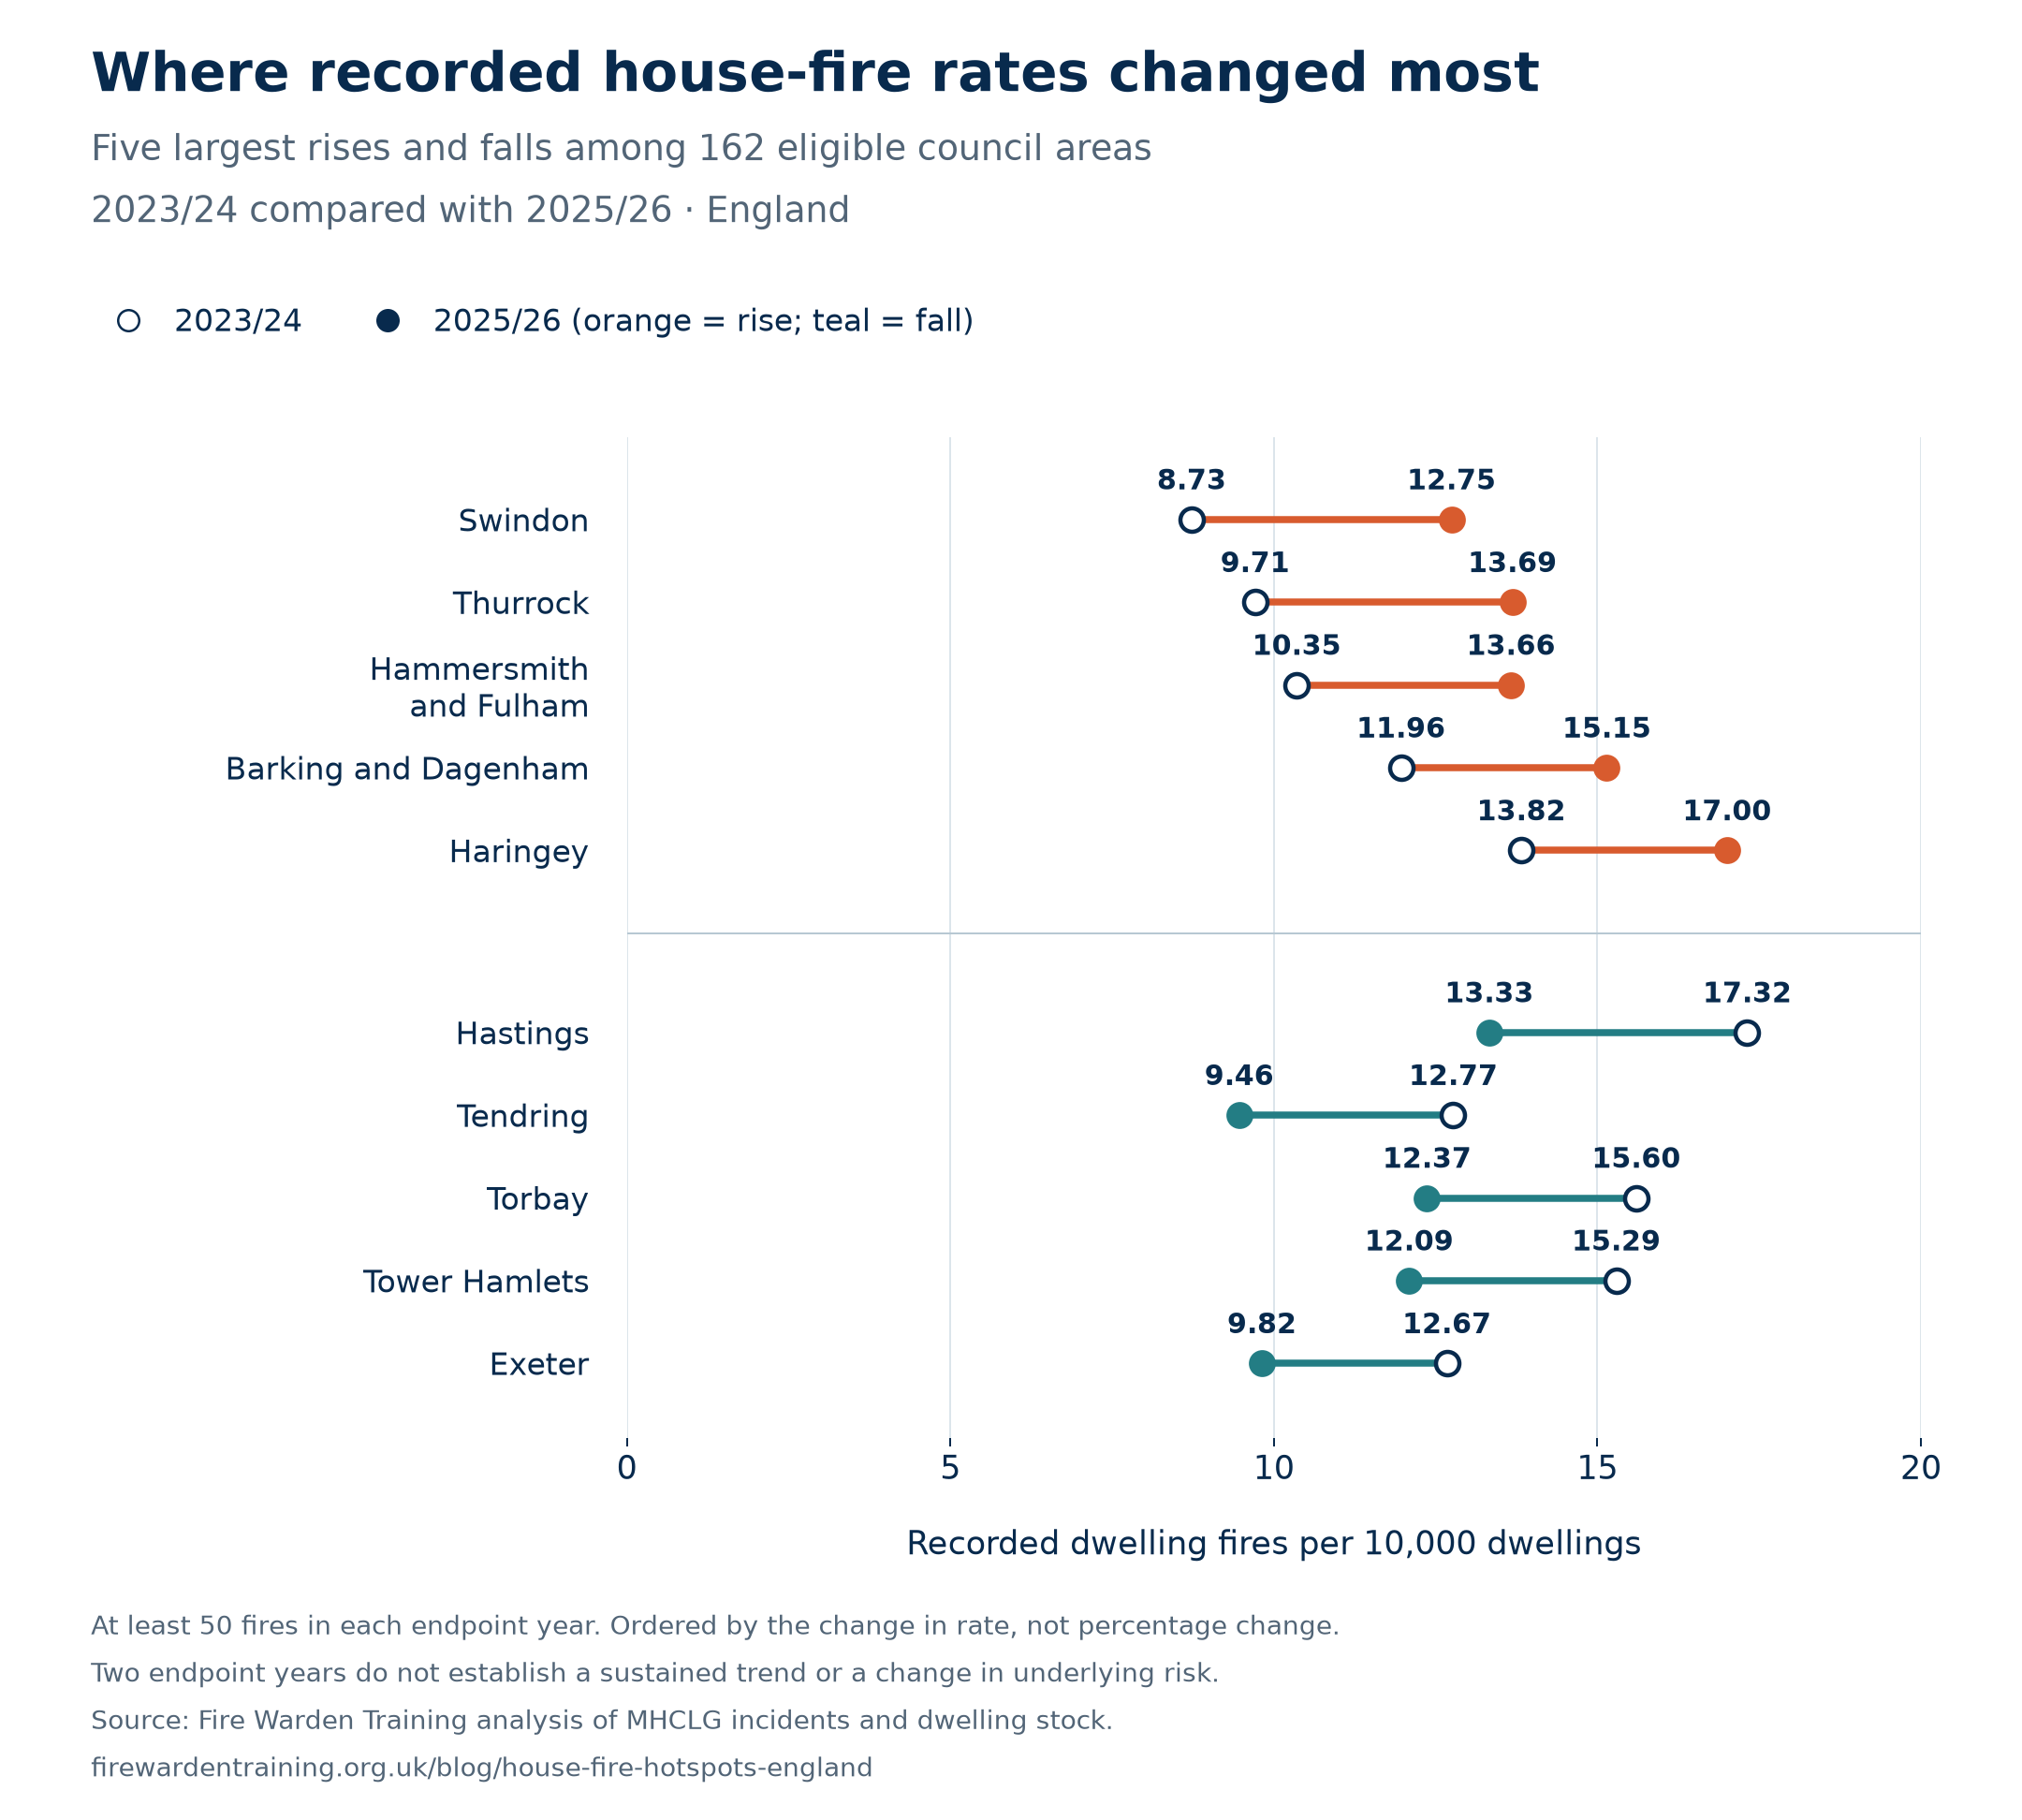
The highest and lowest rates in every region
A national ranking can hide useful local contrasts. This table shows both ends of the comparison within each of England’s nine regions. Select a council to open its annual figures and local profile.
| Region | Highest recorded rate | Lowest recorded rate | Councils ranked |
|---|---|---|---|
| East Midlands | Nottingham16.64 | Derbyshire Dales5.26 | 35 |
| East of England | Norwich16.48 | East Cambridgeshire4.81 | 40 |
| London | Hackney16.21 | Richmond upon Thames8.83 | 32 |
| North East | Newcastle upon Tyne13.49 | North Tyneside7.71 | 12 |
| North West | Manchester16.70 | Cheshire East5.84 | 35 |
| South East | Hastings15.06 | Hart4.43 | 64 |
| South West | Gloucester14.18 | East Devon6.57 | 26 |
| West Midlands | Birmingham16.15 | South Staffordshire5.94 | 30 |
| Yorkshire and the Humber | Kingston upon Hull, City of13.02 | East Riding of Yorkshire6.09 | 15 |
Same eligibility rules as the national ranking: 289 councils included, seven excluded. London excludes the City of London; the East of England excludes the five Suffolk councils with incomplete records; the South West excludes the Isles of Scilly. Rankings use unrounded rates and do not establish a statistically significant difference between neighbours.
How the study works
Why does this study cover England rather than the whole UK?
The incident data, dwelling-stock estimates and council boundaries used here cover England. This is not a UK-wide ranking. Adding Scotland, Wales and Northern Ireland would require comparable fire definitions, reporting periods and housing denominators before their areas could be ranked fairly alongside English councils.
The calculation
We pooled three complete financial years to reduce the influence of a single unusual year. Each year’s fires are paired with the housing stock at the start of that financial year: the 31 March 2023, 2024 and 2025 dwelling estimates.
÷ (dwellings in March 2023 + March 2024 + March 2025) × 10,000
For example, Manchester’s calculation is 1,208 ÷ 723,525 × 10,000 = 16.70. The denominator sums three annual housing snapshots, so the result is an annualised rate rather than a three-year cumulative rate. We use unrounded dwelling estimates and unrounded rates to assign ranks.
How the changes are compared
The endpoint comparison subtracts each area’s 2023/24 rate from its 2025/26 rate. Each rate divides that year’s fires by the corresponding starting-year dwelling stock and multiplies by 10,000. We calculate from the underlying counts and housing estimates before rounding. Areas must qualify for the main ranking and record at least 50 fires in each endpoint year; 162 areas meet this rule. Ordering by rate-point change avoids giving a very small starting rate disproportionate prominence. The separate CSV includes all 289 main-ranked areas and flags the 127 that do not meet this stricter rule. This is a descriptive, exploratory comparison, without a test of statistical significance or adjustment for multiple comparisons.
Sources and dates
The numerator comes from MHCLG’s low-level geography incident dataset, published 22 July 2026, using records received by 1 May 2026. We select only the category “Primary fire - dwelling”. The denominator is Live Table 125, the unrounded dwelling-stock worksheet released in May 2026. The housing estimates used here are provisional and may be revised.
Consistent council boundaries
We link 2021 Census Lower Layer Super Output Area (LSOA) codes to the corrected ONS May 2024 best-fit lookup, then sum the records for each council area. These are statistical areas on a fixed geography, not a claim that every boundary is unchanged today. Maps use the matching ONS May 2024 boundaries.
For Cumberland, Westmorland and Furness, North Yorkshire and Somerset, the March 2023 housing figure is the sum of the predecessor districts replaced in the April 2023 reorganisation. The reconstruction and each component are in the audit download. After reconstruction, the 296 council housing totals reconcile exactly to the published England total in all three years.
Which records and areas are excluded?
- Suffolk: Babergh, East Suffolk, Ipswich, Mid Suffolk and West Suffolk are not ranked because the source guidance identifies missing incidents from September 2024 to March 2025. Their observed counts remain in the download and table, clearly flagged as incomplete.
- Small counts: we require at least 20 fires across the three years for the main ranking. This rule excludes City of London (12) and Isles of Scilly (4). It limits unstable comparisons but is not a statistical significance test.
- Unmatched locations: 14 dwelling-fire records cannot be allocated through the English lookup: 13 have an unknown location code and one has a Welsh LSOA code. They are omitted from council totals, without guessing a location.
Checks and limitations
The source contains 25,592 dwelling fires for 2023/24, 25,465 for 2024/25 and 26,180 for 2025/26. These reconcile to allocated records plus the 14 unmatched records. The later October 2026 version of FIRE0202 reports 25,592, 25,466 and 26,210 respectively. Those later revisions cannot be assigned to councils from this release, so this study consistently uses the July incident dataset rather than mixing versions.
Fires are recorded incidents, not unique properties. A fire affecting multiple dwellings and repeat incidents at the same address do not translate directly into households affected. Rates are not adjusted for building type, household characteristics, deprivation or reporting differences; the study does not establish what causes a higher or lower rate. Separate chimney fires and incidents outside the selected category are excluded.
Starting-year housing stock is an approximation of homes exposed over the year and includes vacant dwellings. There is no claim of statistical significance between neighbouring ranks. The recording system changed from IRS to FaRDaP in November 2025, and official records and estimates can be revised. This is an independent analysis by Fire Warden Training, not an official government ranking.
Local awareness, practical action
A low area rate does not make an individual home fireproof. A high rate does not explain the cause or identify a particular household’s risk.
For practical advice, use the government’s fire safety in the home guidance and your local fire and rescue service. Our home fire safety visit statistics explain the wider prevention activity.
Use the figures in your reporting
The full table, charts and calculation notes are available below. Please retain the period, rate definition and exclusions when reporting the results.
Writing about this research?
Please credit Fire Warden Training and include a link to this study when using our analysis, rankings, charts or map. This helps readers check the original figures, sources and methodology.
Suggested credit: Source: Fire Warden Training, England’s House-Fire Hotspots (2026), analysis of MHCLG data with ONS geography.
Our original analysis and charts are available under CC BY 4.0. Underlying government and ONS material retains its Open Government Licence terms and the attribution shown on the map. For questions or corrections, contact Fire Warden Training.
Data sources and supporting research
Sources checked on 7 November 2026. The original fire-rate calculation, the later national cross-check and the explanatory research are listed separately so the figures can be traced to the version used.
- MHCLG: low-level geography fire incidents
Primary dwelling-fire records for 2023/24–2025/26, from the 22 July 2026 release. Exact source download.
- MHCLG: low-level geography dataset guidance
Definitions, recording limitations and the missing Suffolk records.
- MHCLG: dwelling stock, Live Table 125
Unrounded dwelling estimates at 31 March 2023, 2024 and 2025. Exact source download.
- ONS: corrected LSOA 2021 to council 2024 lookup
Best-fit allocation of incident locations to consistent May 2024 council boundaries. Exact source download.
- ONS: May 2024 council boundaries
Generalised boundaries used to draw the map. Exact source download.
- MHCLG: fire statistics tables, FIRE0202
October 2026 national totals used to document later revisions, not to replace the July council records. Exact source download.
- Government guidance: local government structure
Context for the April 2023 council reorganisations and housing-stock reconstruction.
- MHCLG: English Indices of Deprivation 2025
Corrected File 10 v2: council-level IMD rank of average score, used only for the contextual comparison. Exact source download.
- Taylor and colleagues: deprivation and accidental dwelling fires in Greater Manchester
Fire and Materials, published 12 March 2026; study period 2013/14–2023/24. Supporting research, not an input to the rankings.
- MHCLG: detailed fire analysis, year ending March 2026
National context on ignition sources and fatalities; not a council-level cause breakdown.
- Government guidance: fire safety in the home
Practical safety guidance linked from the article.
Original source URLs and file checksums · Context sources and deprivation workbook checksum